 Credit: Patrick Campanale / How-To Geek
As of writing, my NVMe SSD is about four years old—old enough to make me think about replacing it. That said, with sky-high storage prices right now, part of me wants to hold off until the market settles down. The sensible move in that situation is to check whether your drive really needs replacing—but I didn’t expect I’d have to switch operating systems just to find the answers I was looking for.
Windows said my SSD was healthy
But it felt—as the kids are calling it these days—sus
Windows offers very basic tools for monitoring SSD health. Typically, you’d open the terminal and run the following command:
Get-PhysicalDisk | Select FriendlyName, MediaType, HealthStatus, OperationalStatus, Size
However, it only tells you whether your storage device is healthy or not. That’s useful, but it felt a bit too binary for my liking. I wanted to know how healthy it was. It was less of a qualitative question and more of a quantitative one.
Unfortunately, none of Windows’ built-in tools had that answer, so I installed CrystalDiskInfo—which, frankly, I should have been running years ago. The difference in information density was significant. Beyond the basic “Healthy” label, it showed the drive’s full S.M.A.R.T. data: total data written, total data read, power-on hours, available spare capacity, and—most importantly for my purposes—a “Percentage Used” figure that reflects endurance consumption based on the manufacturer’s TBW (terabytes written) rating.
Why the data felt worrisome
My Crucial P3 500GB NVMe drive—the one holding my Windows installation—currently shows a health rating of 77%. Given that I’ve been using it for roughly four years, the rough math suggests I’ve still got another year or year and a half before it drops below 70%—a point where you should actually start thinking about a replacement.
But that assumes SSD wear follows a linear pattern. What if it doesn’t? What if degradation accelerates?
A drive doesn’t always fail predictably. It can report 100% health one day and die the next. That’s why raw health percentages only tell part of the story. You also need to look at the errors accumulating underneath.
And while my drive showed zero critical warnings, CrystalDiskInfo surfaced one number that kept bothering me: the “Number of Error Information Log Entries” was sitting at 6,605. However, it didn’t tell me what those errors actually were. At that point, I had practically hit the ceiling of what Windows-based tools could tell me.
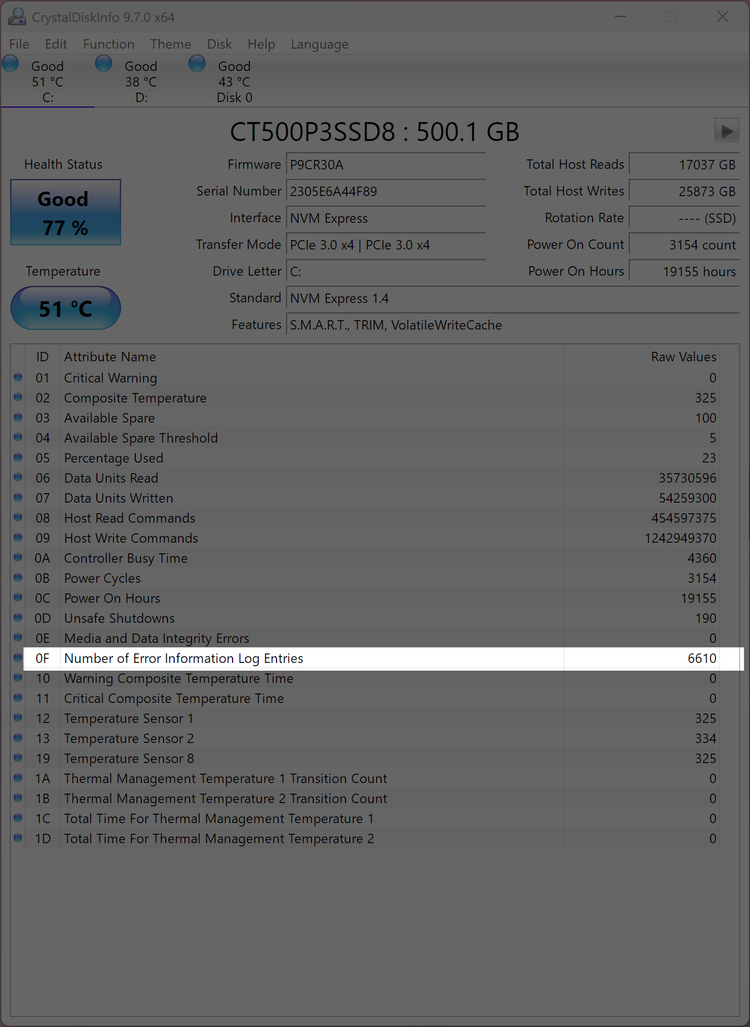
The image above shows the count at 6,610. This is because I took the image after I restarted Windows, which apparently raised the error count.

Your ‘100% Health’ SSD score is a trap: The hidden signs of silent data corruption
Your SSD may be hiding errors, and you won’t know until it’s too late
Linux showed me what those SSD errors actually were
Where CrystalDiskInfo’s trail went cold
I run a Linux-Windows dual-boot setup, so after hitting a dead end on Windows, I booted into Linux to see if I could find some answers there.
On Linux, there’s a command-line utility called nvme-cli built specifically for inspecting NVMe drives. It talks to the NVMe protocol directly, which means it can pull diagnostic data that generic S.M.A.R.T. tools either can’t access or don’t expose clearly.
I started with:
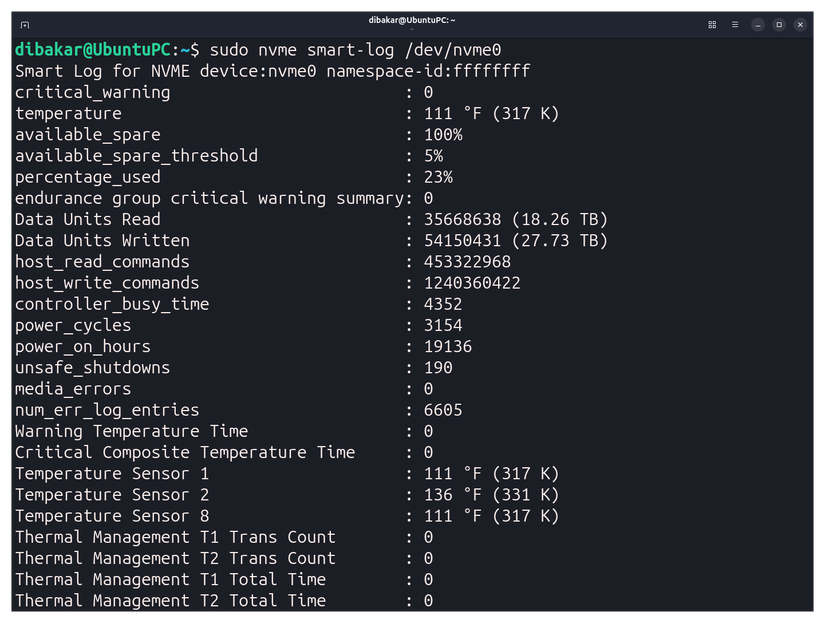
sudo nvme smart-log /dev/nvme0
This pulled the full S.M.A.R.T. log straight from the drive controller and confirmed what CrystalDiskInfo had shown—but with more detail. Available spare was at 100%, media errors were 0, the percentage used was 23%, and the error log entry count was 6,605—the same number Windows showed.
But this time, I could actually inspect what those errors were with:
sudo nvme error-log /dev/nvme0
The log returned 16 entries. Entry 0—the one accounting for all 6,605 flagged errors—had a status field of 0x2002, which decodes to Invalid Field in Command: a reserved code value or an unsupported value in a defined field.
Entries 1 through 15, meanwhile, all showed an error count of 0 and “Successful Completion.”
Translated into plain English, my SSD was fine. There were no media errors, no data integrity issues, and no signs of physical NAND failure. The “errors” weren’t signs of wear—they were just invalid commands logged at some point during normal operation.
You can also test your NVMe SSDs for errors
The self-test Windows never offered me
The nvme-cli utility can do more than just read health data—it can also run built-in diagnostic tests on the drive itself. So I ran a short self-test using:
sudo nvme device-self-test /dev/nvme0 -s 1
Then I checked the results with:
sudo nvme self-test-log /dev/nvme0
The test came back clean: Operation Result: 0, which means the drive passed without detecting any internal issues.

You are testing your PC performance wrong—here is the right way
Synthetic benchmarks are fine, but real-world benchmarks are much better.
You don’t necessarily need to install Linux to run this tool
If you’re on Windows and don’t run a dual-boot setup like I do, you can still use nvme-cli without installing Linux.
The easiest method is to create a bootable USB with Ubuntu—or any Linux distro you prefer—plug it into your PC, and boot into the live environment. That gives you a full Linux session running directly from the USB, without touching your existing Windows installation. From there, you can install and use nvme-cli to inspect your SSD’s health, run self-tests, and check error logs. Once you’re done, just reboot back into Windows as usual.


1