Credit: Tony Phillips/How-To Geek
Most Excel tutorials hand you a sales spreadsheet from a fictional company and tell you to practice pivot tables on data you don’t care about. That method of learning or coming back to Excel doesn’t work for everyone. The trick to actually retaining this stuff is working with data that means something to you. If you grew up playing Pokémon, you’ll know how structured the games are and how well they’d translate into real excel spreadsheet problems.
Build a battle dashboard for gym leaders
A gym leader dashboard is basically a crash course in spreadsheet management
-
 Credit: Jorge Aguilar / How-To Geek
 -
 Credit: Jorge Aguilar / How-To Geek
 -
 Credit: Jorge Aguilar / How-To Geek
 -
 Credit: Jorge Aguilar / How-To Geek
 -
 Credit: Jorge Aguilar / How-To Geek
-
 Credit: Jorge Aguilar / How-To Geek
 -
 Credit: Jorge Aguilar / How-To Geek
 -
 Credit: Jorge Aguilar / How-To Geek
 -
 Credit: Jorge Aguilar / How-To Geek
 -
 Credit: Jorge Aguilar / How-To Geek
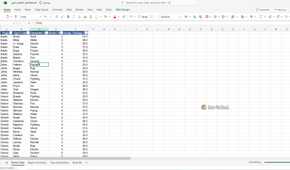
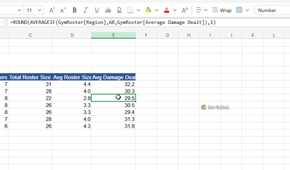
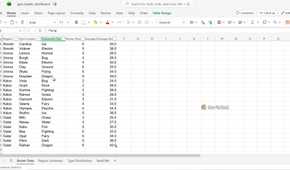
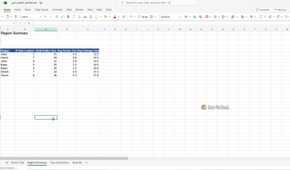
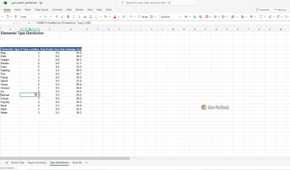
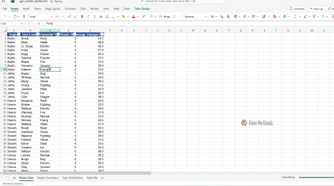
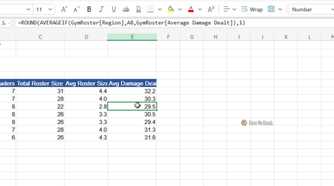
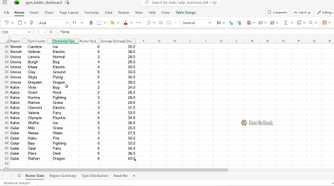
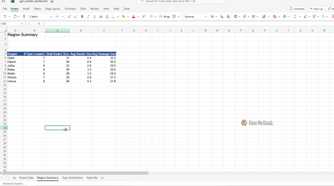
You can get the information on gym leaders really quickly thanks to places like Bulbapedia. If you want to practice Excel, you should make a Gym Leader battle dashboard. This is like an interactive report for a Pokémon Champion to scope out challengers and prep for fights. It’s an easy excel trick that I do for nuzlockes all the time.
Keep your dataset simple and stick to Region, Gym Leader, Elemental Type, Roster Size, and Average Damage Dealt. Putting that together already gets you thinking about how to organize data properly and how to keep static stuff like regions separate from battle records that change constantly. It also prepares your party for the fight.
First thing you do is convert everything into properly named Excel Tables. That way, Excel doesn’t hand you those awful generic names like Table1 or Table2, which get impossible to manage fast.
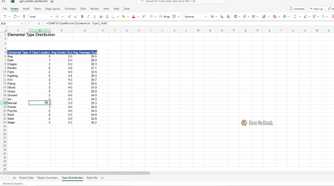
Then you bring in Pivot Tables to summarize regional stats and elemental distributions. These run on the Excel PivotCache, which is basically an in-memory, columnar copy of your data. Pivot Tables built from the same source share one PivotCache, so any grouping you do in one shows up in all the others. That’s sometimes useful but often annoying when you want different groupings, so you learn to force separate caches using the old ALT + D + P shortcut or by splitting data into separate named Tables.
Make a simulator for shiny hunting odds
Simulating shiny hunting odds is probability modeling in disguise
 Credit: Jorge Aguilar / How-To Geek
So, instead of just staring at standard financial risk metrics, you can actually learn probability modeling by simulating those brutal rare events. The whole idea is to model what it really takes to find a Shiny Pokémon, which has that famously miserable 1 in 4096 drop rate.
You start by filling a column with 5,000 encounters. Each row uses a randomized logical formula that marks the attempt as either common or shiny. It’s a basic Bernoulli trial, and in Excel it looks like this:
=IF(RAND() < 1/4096, 1, 0)The RAND() function spits out a random number between 0 and 1, and because RAND() is what they call volatile, Excel treats it as permanently dirty.
Any time you edit anything in any open workbook, Excel skips its usual smart recalculation and just recalculates the whole random formula along with everything downstream. So you end up with a column of ones and zeros where 1 means shiny and 0 means regular.
After that, you use Excel’s What If Analysis Data Tables to run this whole 5,000 encounter sequence 1,000 separate times at once.
This whole exercise is basically the same thing corporate risk analysts do with Monte Carlo simulations, running the same scenario over and over to see how bad things could realistically get.
Build a catch rate calculator for formulas
A catch rate calculator gets you deep into formula building without you noticing
 Credit: Jorge Aguilar / How-To Geek
A catch rate calculator is a surprisingly good way to learn some pretty advanced modeling stuff without it feeling like work. The whole point is to recreate the actual multistep formula from the games, so you can put in a Pokémon’s health, status, and ball type and see the exact percentage chance of catching it.
You start by setting up the multipliers. For example, sleep gets a status modifier of 2.5, and an Ultra Ball has a ball multiplier of 2. It’s basically like building a lookup table where categories like “risk tier” or “asset class” get mapped to specific numbers.
Keeping these multipliers in a separate parameter table is important. You don’t want to hardcode them inside the formula itself because that makes it impossible to see or change your assumptions later. It’s the same reason people complain about bad financial models.
You build one massive formula in a single cell that does everything. The old games ran on 8-bit and 16-bit processors that could only handle integers, so standard decimal division would’ve broken everything. To mirror that in Excel, you use INT or ROUNDDOWN to truncate values at every intermediate step. You also wrap things in MAX and MIN to keep the numbers within hard limits.
Build a tool to evaluate team synergy
Checking team synergy is basically how risk auditing works, just with Pokémon
 Credit: Jorge Aguilar / How-To Geek
Building a tool that auto-flags defensive gaps in a Pokémon team is a great way to learn how real auditing and risk frameworks work. The basic idea is you type in six team members, and the spreadsheet immediately points out where you’ve got a serious shared weakness.
So you start with a simple input area for those six names, just so your main data is locked in. Then you pull each Pokémon’s type profile and weaknesses into a hidden backend grid using XLOOKUP. You point the return range at a multi-column array, and Excel runs the search once, spilling the matching values horizontally across the cells. That cuts way down on calculation time and keeps the dependency tree from getting bloated.
Once the typing data is in, you use SUMPRODUCT with Boolean logic to total up how much damage the whole team would take across all eighteen elemental types. SUMPRODUCT is basically a vector multiplication engine that handles array math on its own. You multiply conditional expressions together or wrap them in a double unary operator, which turns TRUE and FALSE into 1s and 0s.
You should also add conditional formatting that turns cells red when three or more team members share a vulnerability. That visual warning is important, but if you do it badly, like copy-pasting rules all over the place, it slows rendering down. Just go into Rules Manager and merge those broken rules into single unified ranges, which stops scroll stutter and keeps the file from bloating.
You don’t have to be a Pokémon master
You don’t need a deep knowledge of Pokémon to build these sheets. But you do need to think carefully about how data is structured and why formulas behave the way they do, which is the whole point. If you’ve bounced off Excel tutorials before because the material felt too unrelated to your life, working with a game you already understand may be better for you.

Microsoft 365 Personal
OS
Windows, macOS, iPhone, iPad, Android
Brand
Microsoft
Microsoft 365 includes access to Office apps like Word, Excel, and PowerPoint on up to five devices, 1 TB of OneDrive storage, and more.