I can run AI models on this laptop. The bigger question is which jobs I can trust them with. A weak brainstorming suggestion is easy to discard; a wrong total or an action taken on my behalf can cause real trouble. I’ll keep using RTX Spark laptops to test and track these models over time, checking consequential work myself. Speed is useful, but getting the answer right is what makes local AI worth using.
I’ve spent more than a decade on a Mac, going on 15 years, and my MacBook Pro has served me well. I started this first installment on October 15, about 36 hours into using the ASUS ProArt P16 with NVIDIA RTX Spark. It now includes testing through October 16, alongside my setup and everyday experience.
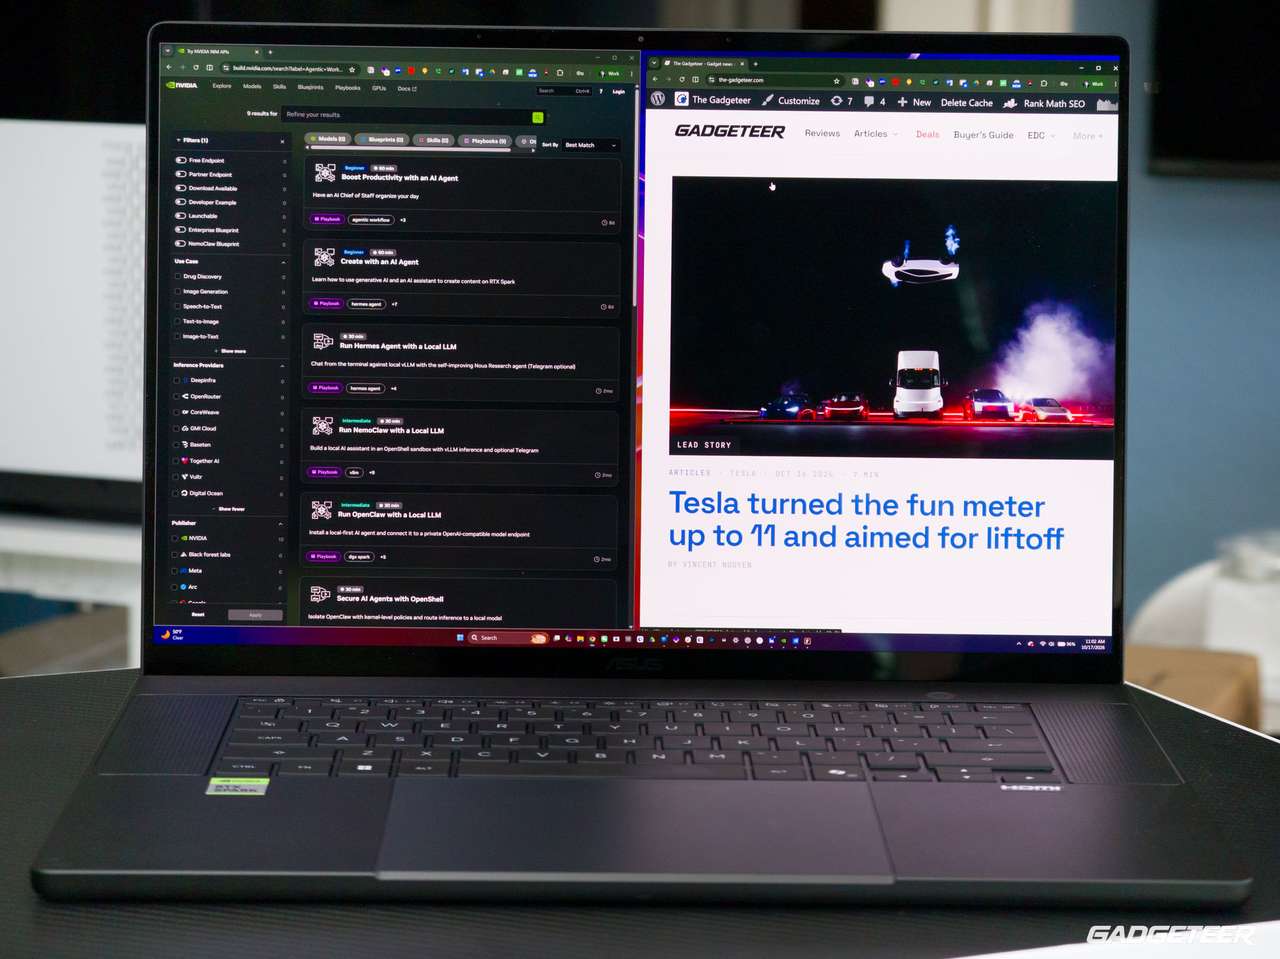
The ProArt is gorgeous, and I love how its weight and proportions feel balanced. The keyboard and trackpad have been excellent to use, and the 4K ASUS Lumina Pro OLED display uses Tandem OLED technology. That’s ASUS’s fingerprint on the machine. RTX Spark gives these laptops a common foundation, but each manufacturer builds its own experience around it, from the design and feel to cooling and power choices. I’m excited about that combination of hardware and local AI, and about following what the models can do as they improve.
I want one machine for my photographs, videos, writing and local AI work, including when I’m traveling. Lightroom, phone photographs, cloud files and dictation all belong in that working day. A benchmark can tell me how quickly a job finishes and how many tokens per second a local AI model generates. Using the laptop for my own work tells me whether I want to keep reaching for it.
The early results now cover creative exports, CPU and graphics performance, storage and several local AI workloads. What interests me is how those pieces fit the same working day. Can I keep editing while a model works through a brief, and is its answer worth the wait?
ASUS ProArt P16 H7607BA: announced US starting price $2,799.99. ASUS lists US online availability beginning October 16. Check the entry ProArt P16 listing at Best Buy, or see ASUS’s 4K Neo White configuration. These are different retail configurations; specifications and pricing vary.
The machine and the setup
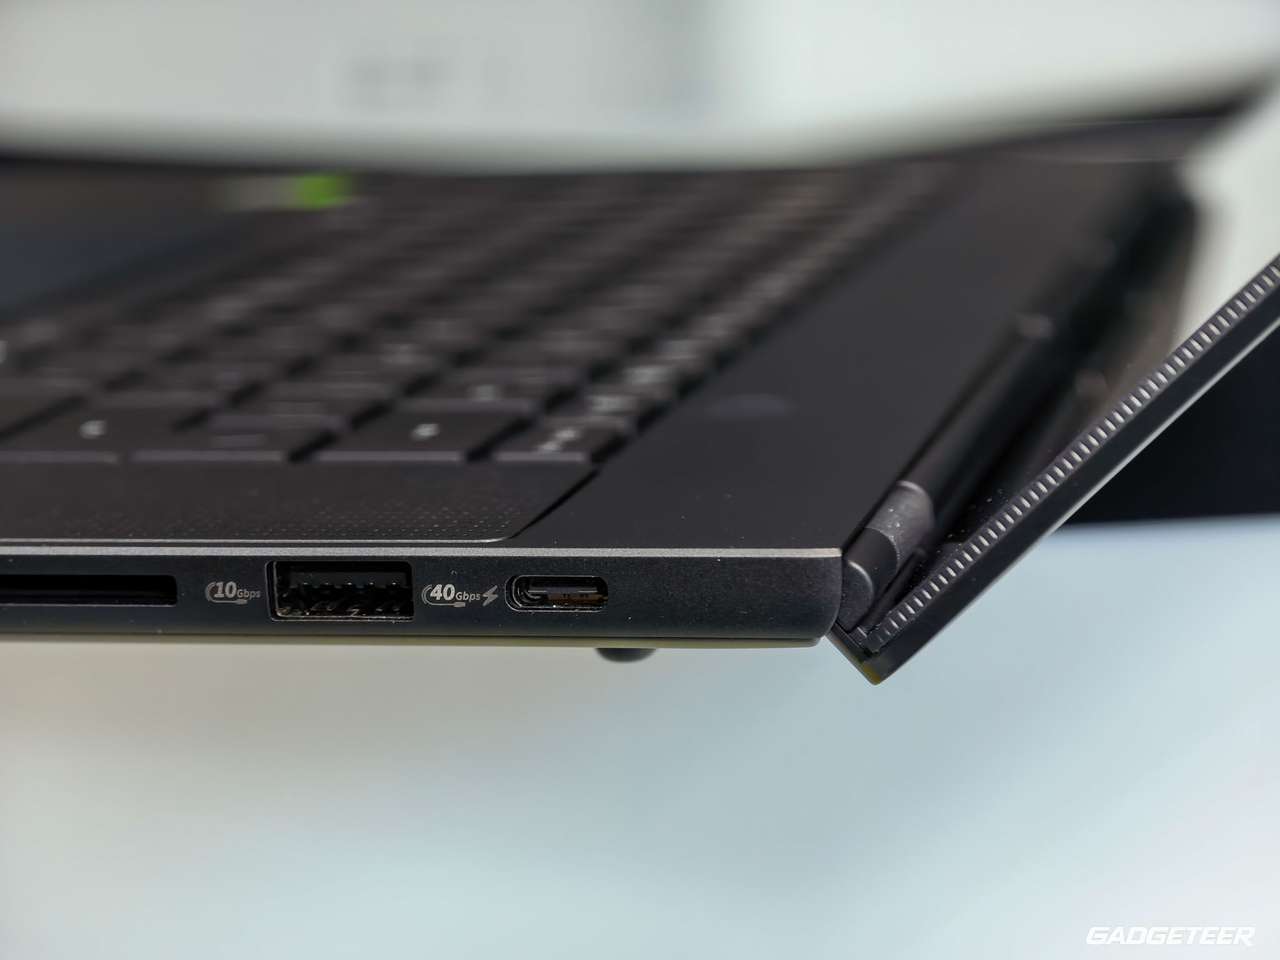
The P16 weighs 3.9 pounds without its charger. I found the broad laptop balanced in my hand during the unboxing and hardware walkthrough. I appreciate having three USB4 ports, HDMI, USB-A, an audio jack and a full-size SD Express reader on the machine.
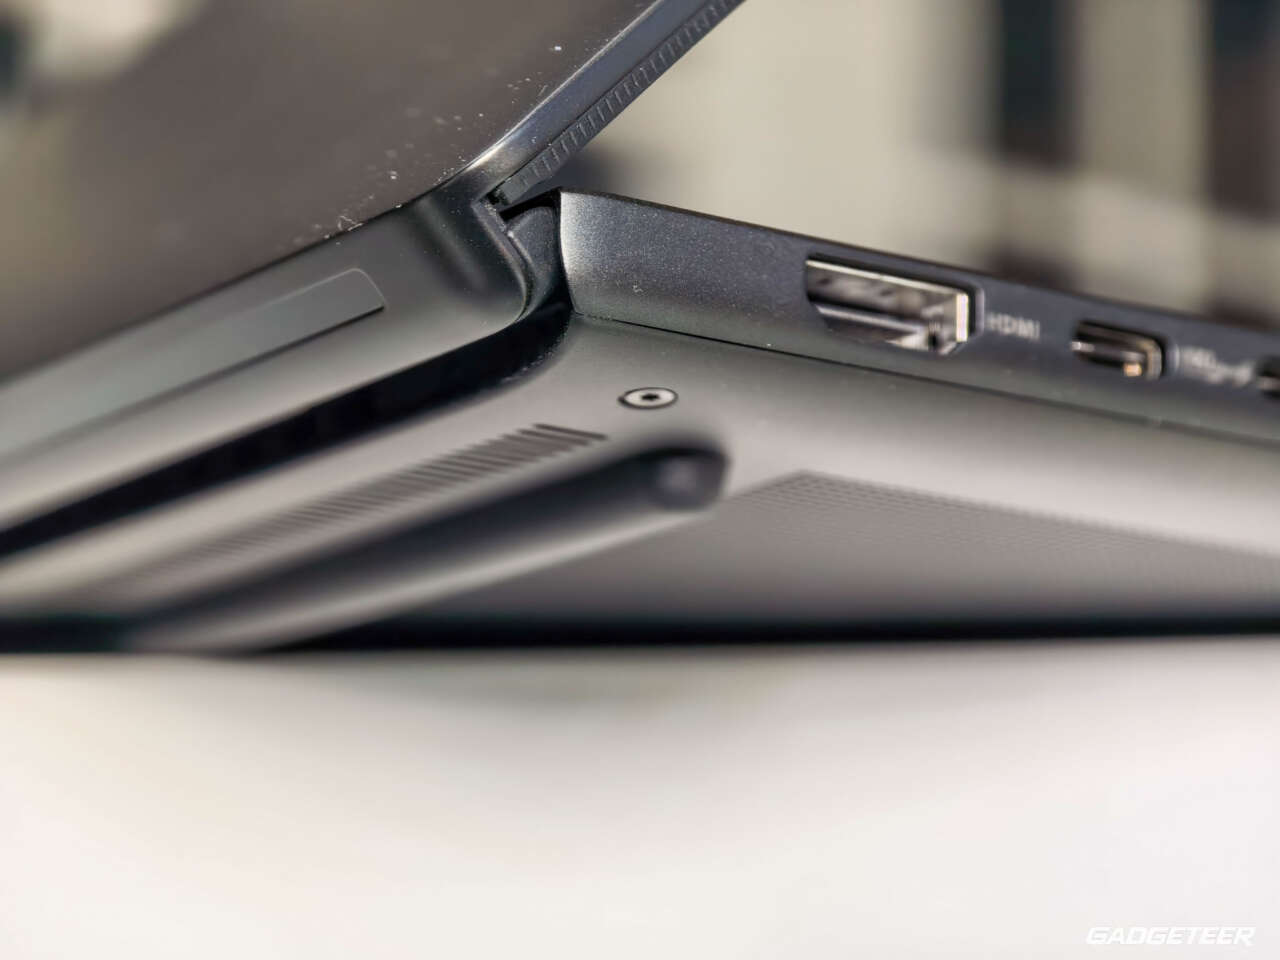
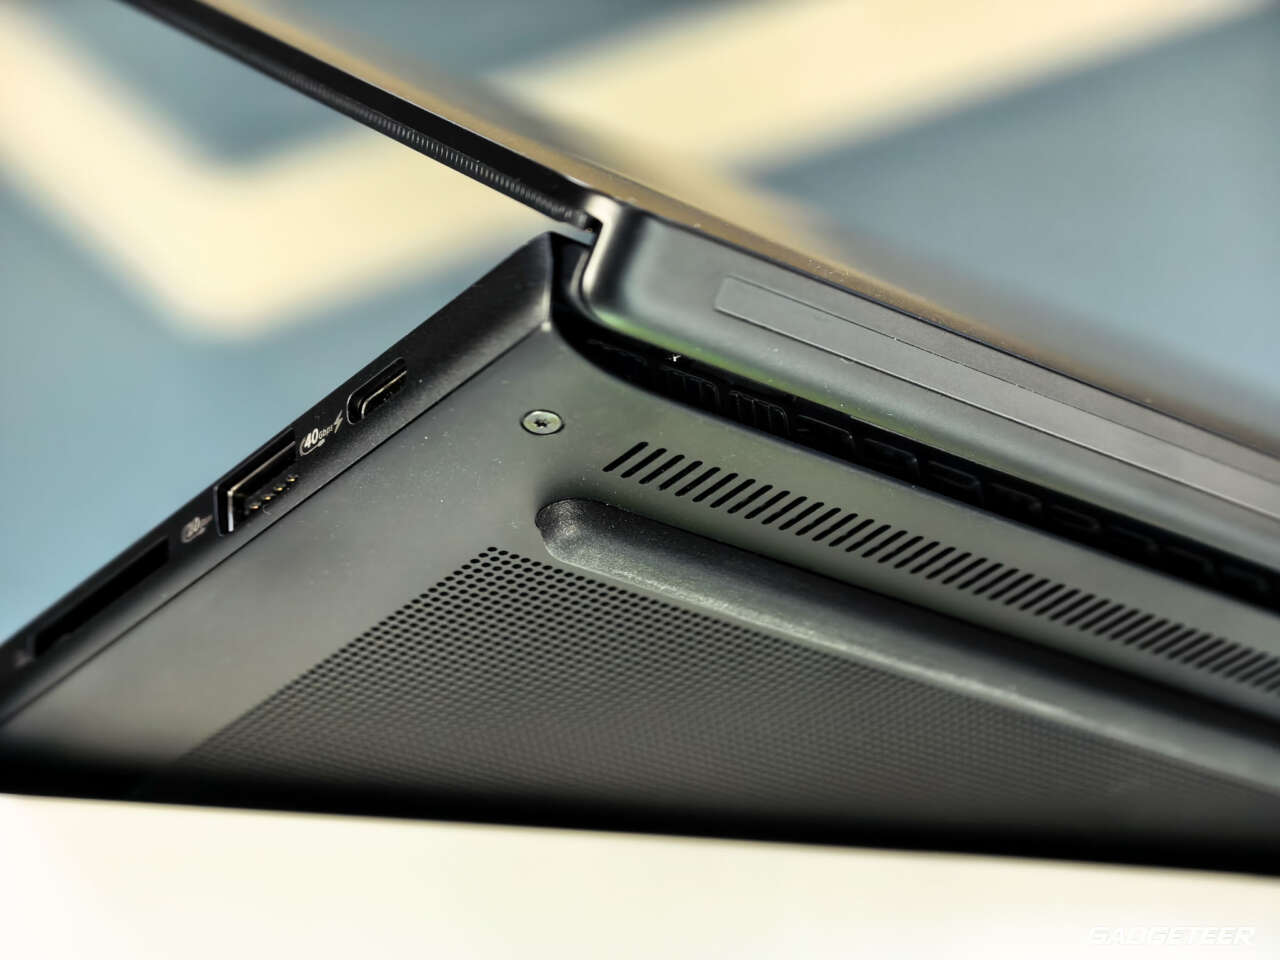
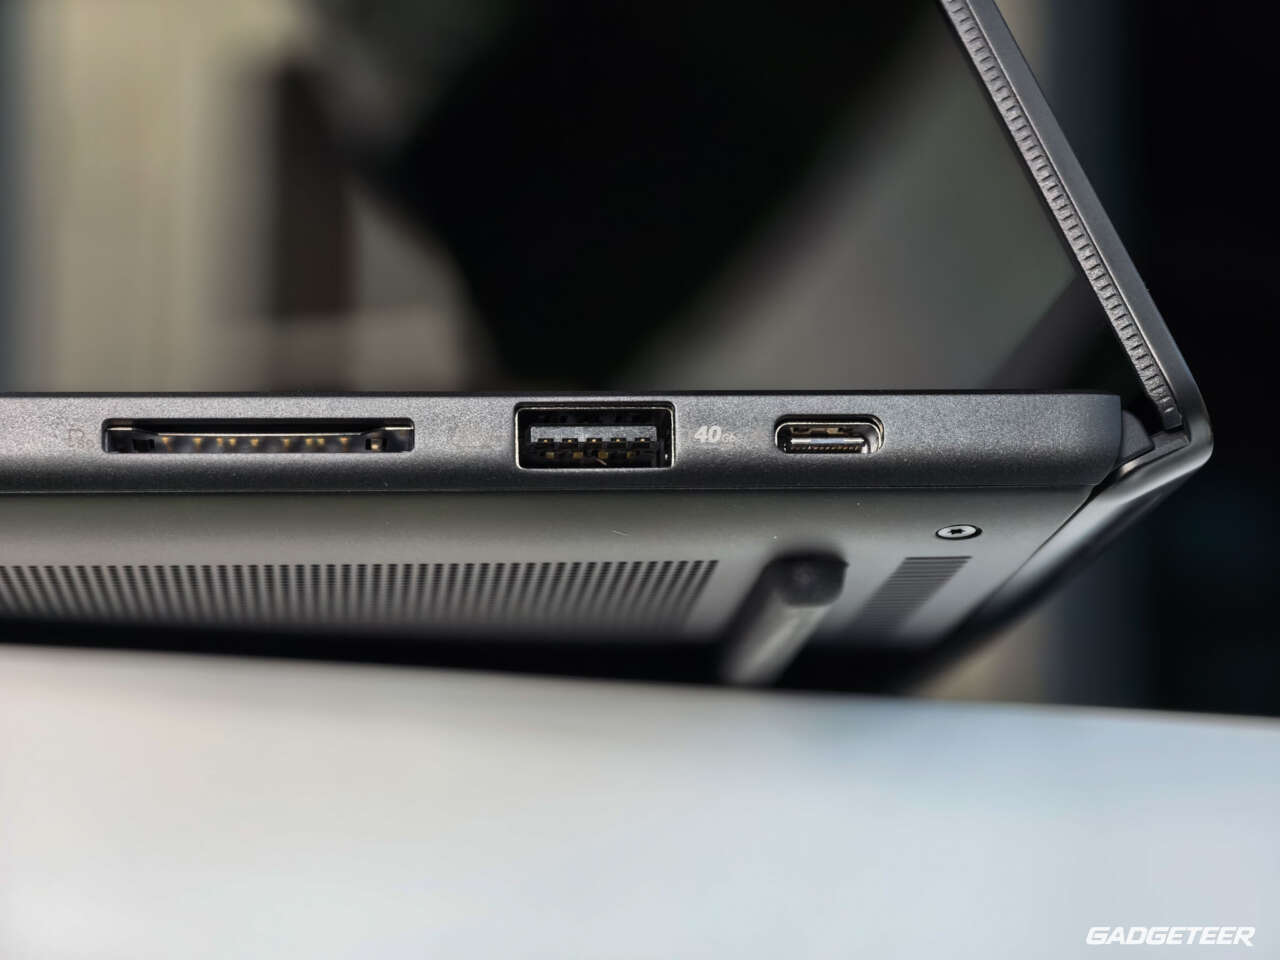
I use the SD card reader often to transfer photos and video from my cameras, including the Insta360 and Luna Pro. Having it built into the P16 gives me one less accessory to pack and keep track of.
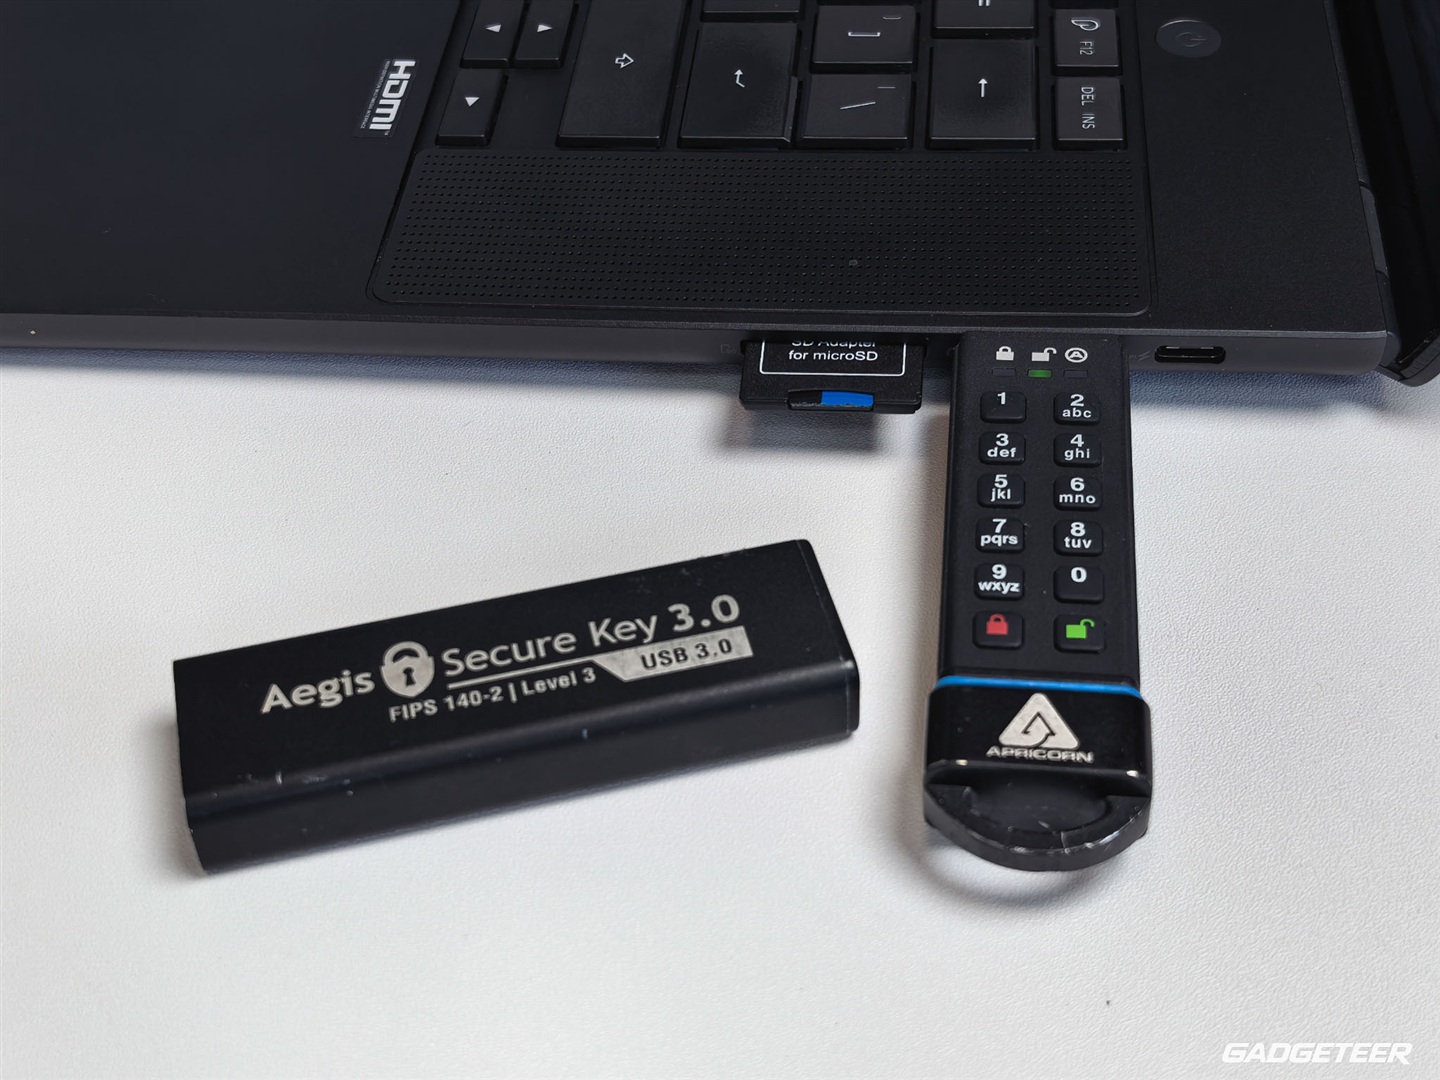
My working setup is Windows 11 Pro on ARM64, with Lightroom for photos, Insta360 Studio for 360 video, Google Drive syncing in the background and Wispr Flow for dictation. I’ve installed ArtCraft as well. I’ve been pushing the ProArt hard, and it’s stayed responsive. I haven’t noticed stuttering or a slowdown as I keep working.
The tests below used BIOS H7607BA.304 and NVIDIA driver 617.21.
My first local AI tests used native ARM64 CUDA llama.cpp b11429 with downloaded Qwen3.8-27B and DFlash draft models. The later 13-model comparison used b11669; its settings are explained alongside those results.
The screen is already earning its space
I’m using the 16-inch, 3840 × 2400 display at 150% scaling. Text looks sharp, and I can spread out more of my work than on the 14-inch Mac setup that was starting to feel cramped. With several applications in my daily routine, that has been one of the most immediately useful changes.
For photo work, the 16:10 shape gives me room for the image and the editing controls around it. I want to see the photograph I’m working on without the rest of the application feeling squeezed in beside it. The P16’s larger screen fits that part of my workflow well, while also giving my documents and other application windows more space.
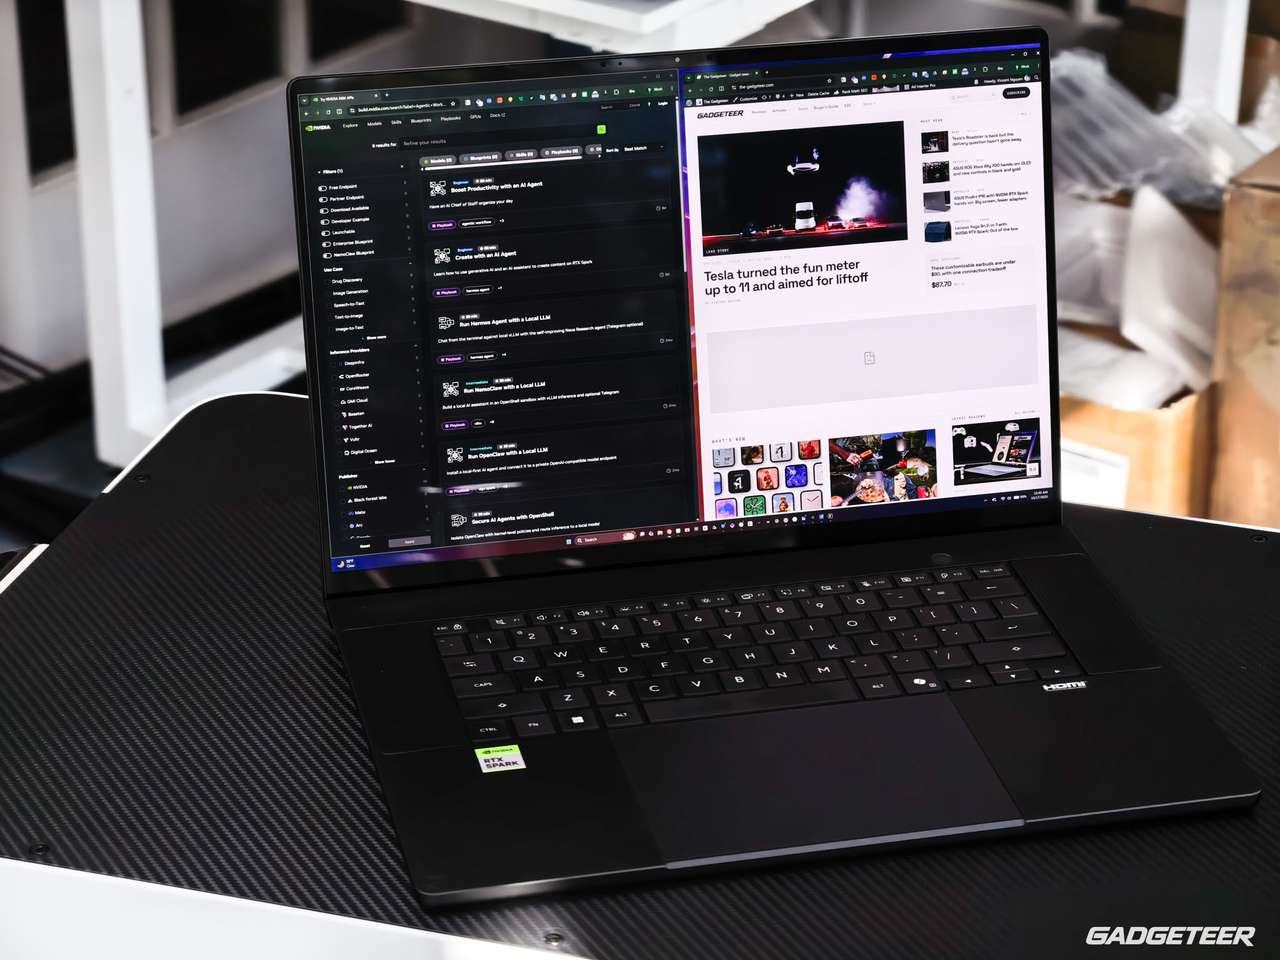
The panel is a 4K OLED touchscreen with a 120Hz refresh rate. My early enthusiasm is about the workspace: I like reading and working on this display. That is something I notice throughout the day, rather than only when I open a benchmark.
Taking that workspace with me is the next step. I’ll be shooting photos and video during the F1 weekend in Austin, and I want to see how the P16 fits into editing away from my desk.
How I read the AI numbers
First-token delay tells me how long I wait for an answer to start; generation speed tells me how quickly it appears. Neither proves it’s correct. The mistakes here concern the models’ answers, with no evidence RTX Spark caused them. Repeated tests help me choose what to trust, but no benchmark guarantees every answer.
The first local AI numbers
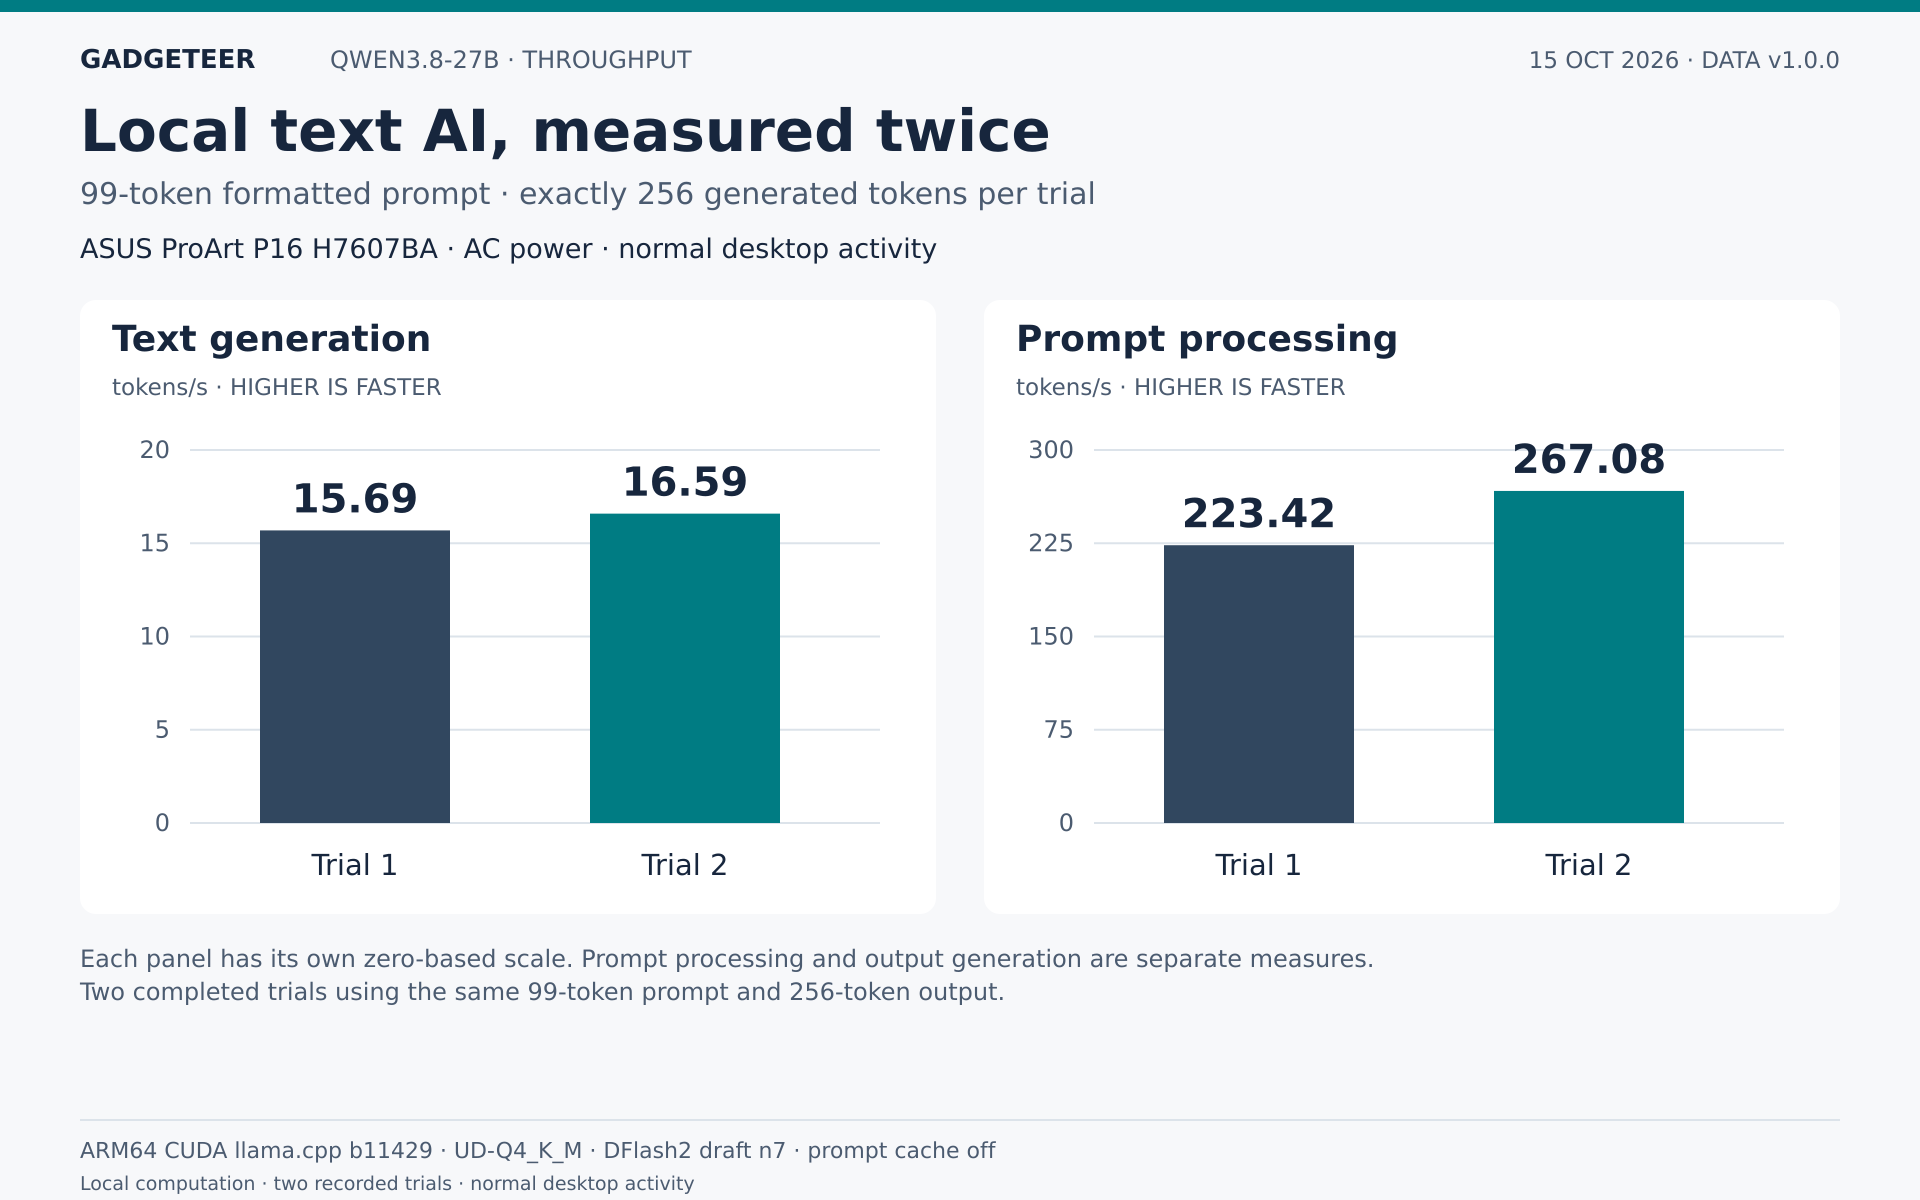
The first measured text-generation workload used Qwen3.8-27B UD-Q4_K_M with a DFlash2-Q4_K_M draft model. Both trials used the same 99-token formatted prompt and generated exactly 256 tokens, with temperature zero, the same seed and prompt caching disabled. The runtime allocated a 262,144-token context, but this was a short-prompt test, not a test with that much input.
The first trial generated 15.69 tokens per second. The second reached 16.59 tokens per second, with the first streamed content arriving in 0.446 seconds. Total request time was 16.70 seconds for the first trial and 15.82 seconds for the second. Both outputs were readable excerpts stopped at the specified token limit.
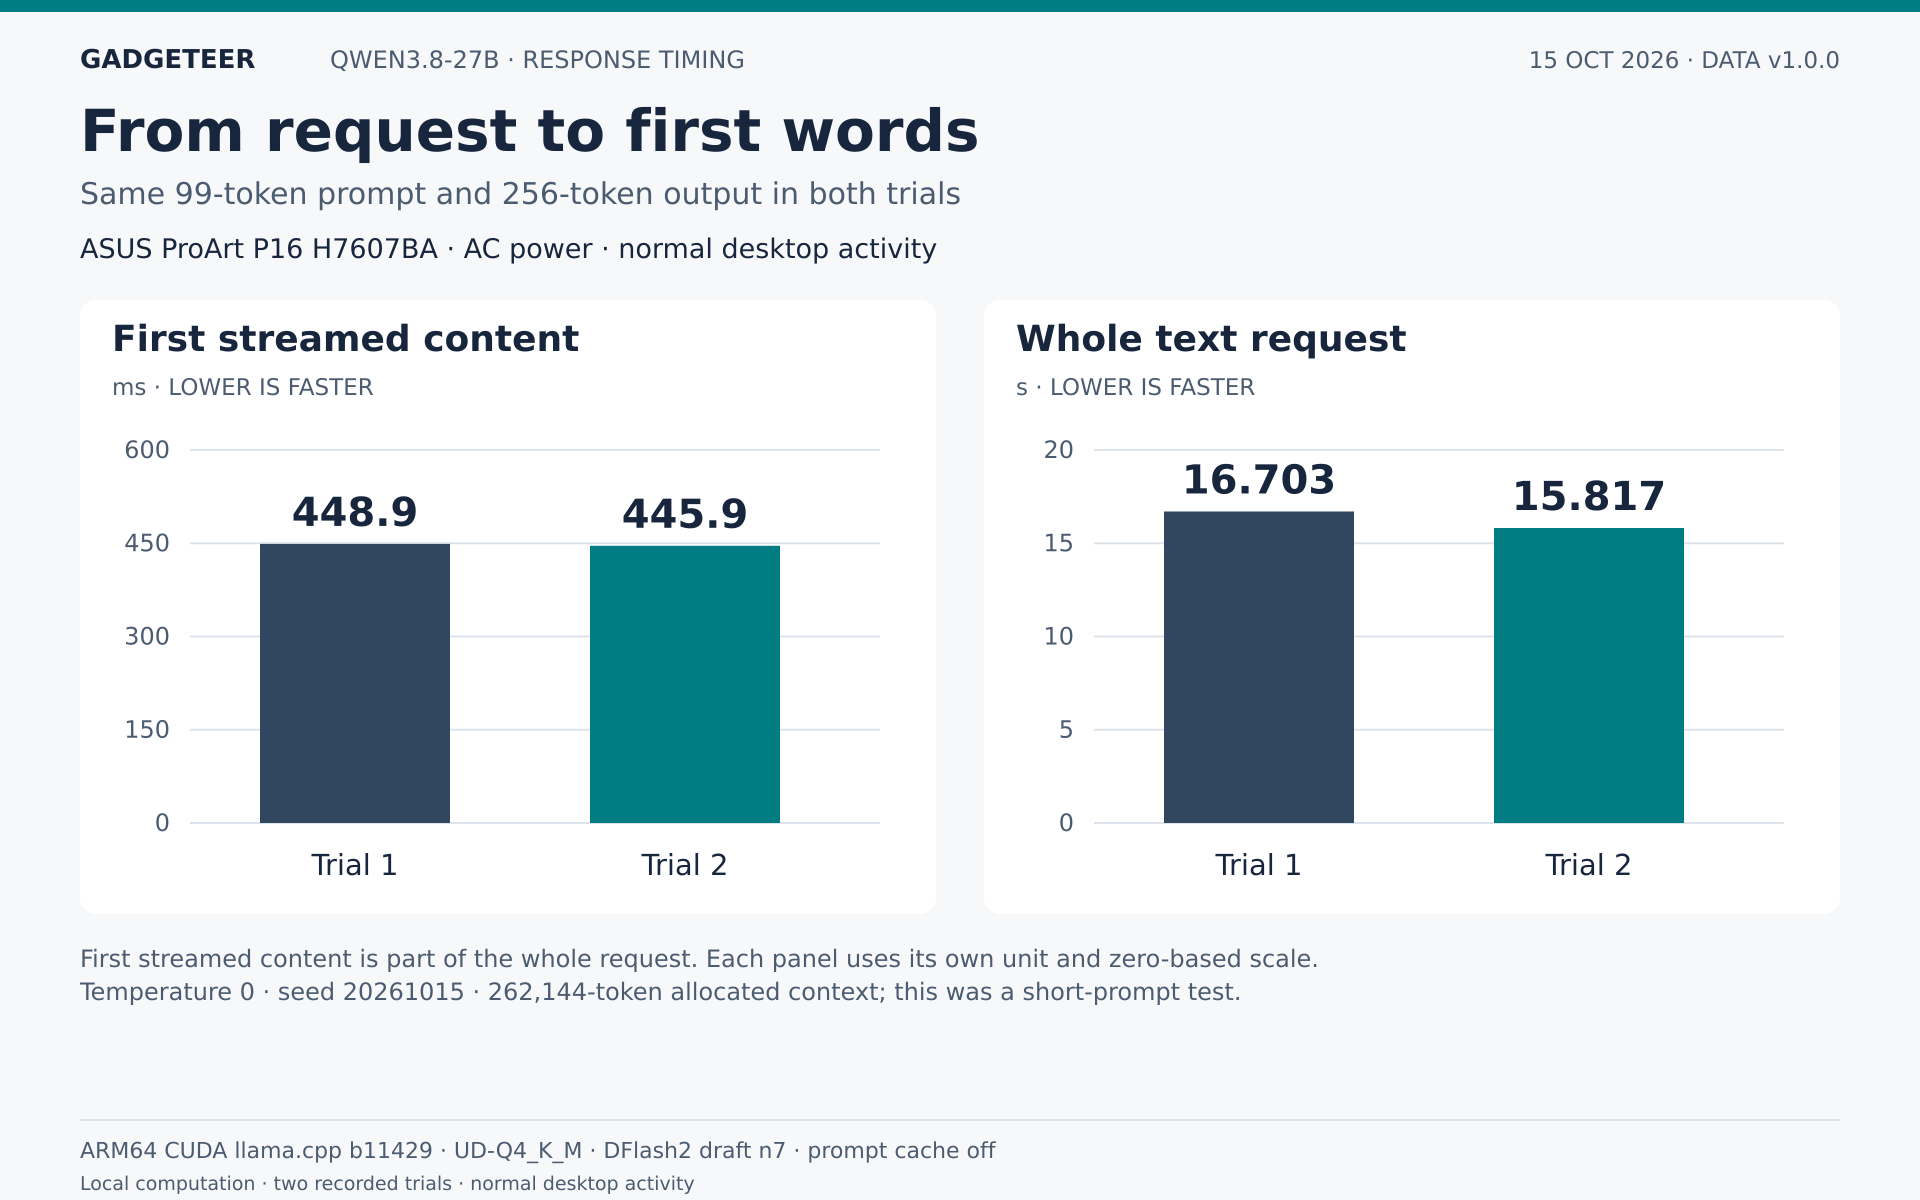
Morning Qwen test conditions: AC power, normal desktop and Drive activity running, and a recorded Balanced base power plan. This was a separate session from the creative tests later that day.
A longer Qwen workload
The next round used Qwen3.5 27B Q4_K_M, a separate model and configuration from the short Qwen3.8 test above. It ran locally through all 30 extended executions, with inputs of 8,192, 16,384 and 32,768 tokens. None reported truncated input or an empty answer.
A separate speed test fed it 8,192 tokens and stopped generation at 1,024 output tokens. Across three runs, the first response arrived after an average 12.2 seconds, the whole request took 85.1 seconds, and generation averaged 14.0 tokens per second. Those are three views of the same job: waiting, finishing and writing speed.
With room for longer answers, the inventory summaries produced 1,319, 1,526 and 1,458 tokens at the three input lengths. Average completion time rose from 105.4 seconds to 149.5 and 202.8 seconds. The answers had different lengths, so those totals don’t isolate the cost of extra input.
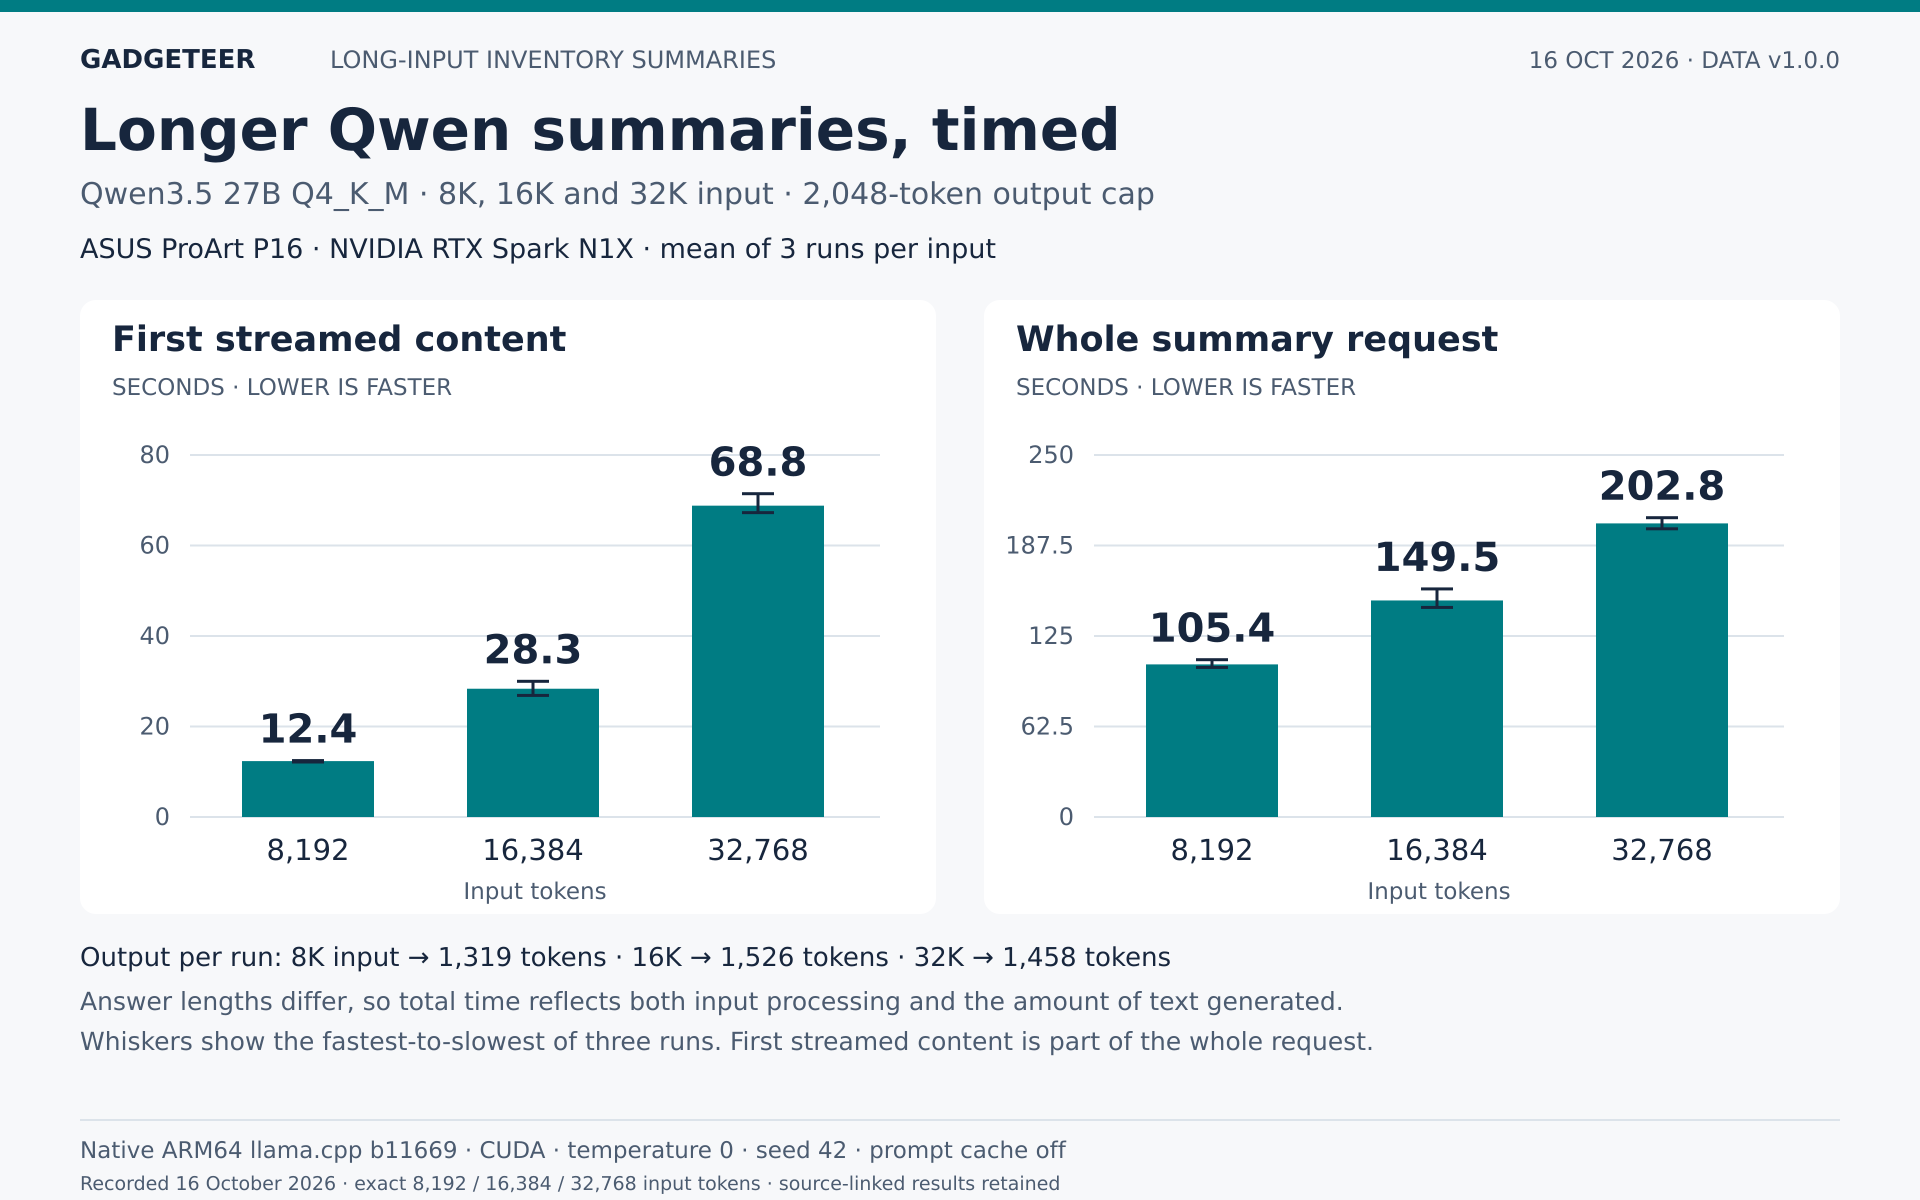
The quality checks gave me a useful distinction. All nine extraction runs returned the requested inventory facts correctly. A separate reasoning question returned 3,660 instead of 4,914 in all nine repeats. The summaries got each item’s calculation right, but added assumptions about premium products and sufficient stock that weren’t in the brief. Three summaries stopped mid-sentence when I limited their output to 1,024 tokens. These were repeated synthetic tasks, not a broad accuracy score.
The fans were clearly audible during the test, though I didn’t find them distracting. The laptop went quiet again once it finished. This was our own workload on native ARM64 llama.cpp b11669 with CUDA, rather than a matched comparison against another laptop.
Local AI: how quickly it answers, and whether it gets the facts right
My agent ran 13 local models on the same fictional product brief, covering NVIDIA’s Nemotron 3.5 Bolt 74B-A9B, four PrismML Bonsai 2 models and eight earlier PrismML Binary and Ternary Bonsai variants. The job was straightforward: pull out ten facts, keep the manufacturer’s battery claim separate from the test result, and leave unknown details blank. This is the kind of small job that comes up when turning a press brief and review notes into a useful product summary.
All 13 models also repeated the extraction with 60 unrelated archive entries between the brief and the question, and generated a short excerpt for a separate speed test. Seven models read the brief as an image and identified two coloured shapes in another picture. The charts separate those jobs so that the time to extract facts isn’t mixed with the rate of writing new text.
The question behind the chart
Here’s the actual fictional brief used for the text extraction:
SYNTHETIC PRODUCT BRIEF. The fictional FieldNote Mini recorder weighs 180 g. Its manufacturer claims up to 12 hours of battery life. It costs US$149. Availability begins November 2, 2026. Recording is stored locally; cloud sync is optional. No waterproof rating is supplied. REVIEW NOTES. In one indoor test at medium gain, the recorder ran for 8 hours 40 minutes. There was one trial. Charging time was not measured. The supplied unit’s colour was graphite.
The exact instruction was:
Use only the supplied brief and notes. Return JSON with exactly: product, price_usd, available_date, weight_g, claimed_battery_hours, tested_battery_minutes, trial_count, waterproof_rating, charging_time_minutes, cloud_required. Use null when unknown. Do not turn a manufacturer claim into a measured result. No extra prose.
JSON is a structured list of named values that another program can read. In everyday terms, the expected answer was: FieldNote Mini; US$149; 2 November 2026; 180 g; a claimed 12-hour battery life; a measured 520 minutes; one trial; unknown waterproof rating; unknown charging time; and no requirement to use the cloud. The battery conversion is eight times 60, plus 40. The 12-hour claim belongs in its own field and mustn’t replace the measured result. The recorder and its test are fictional, so these figures are test inputs rather than a product recommendation.
A quick answer still needs checking
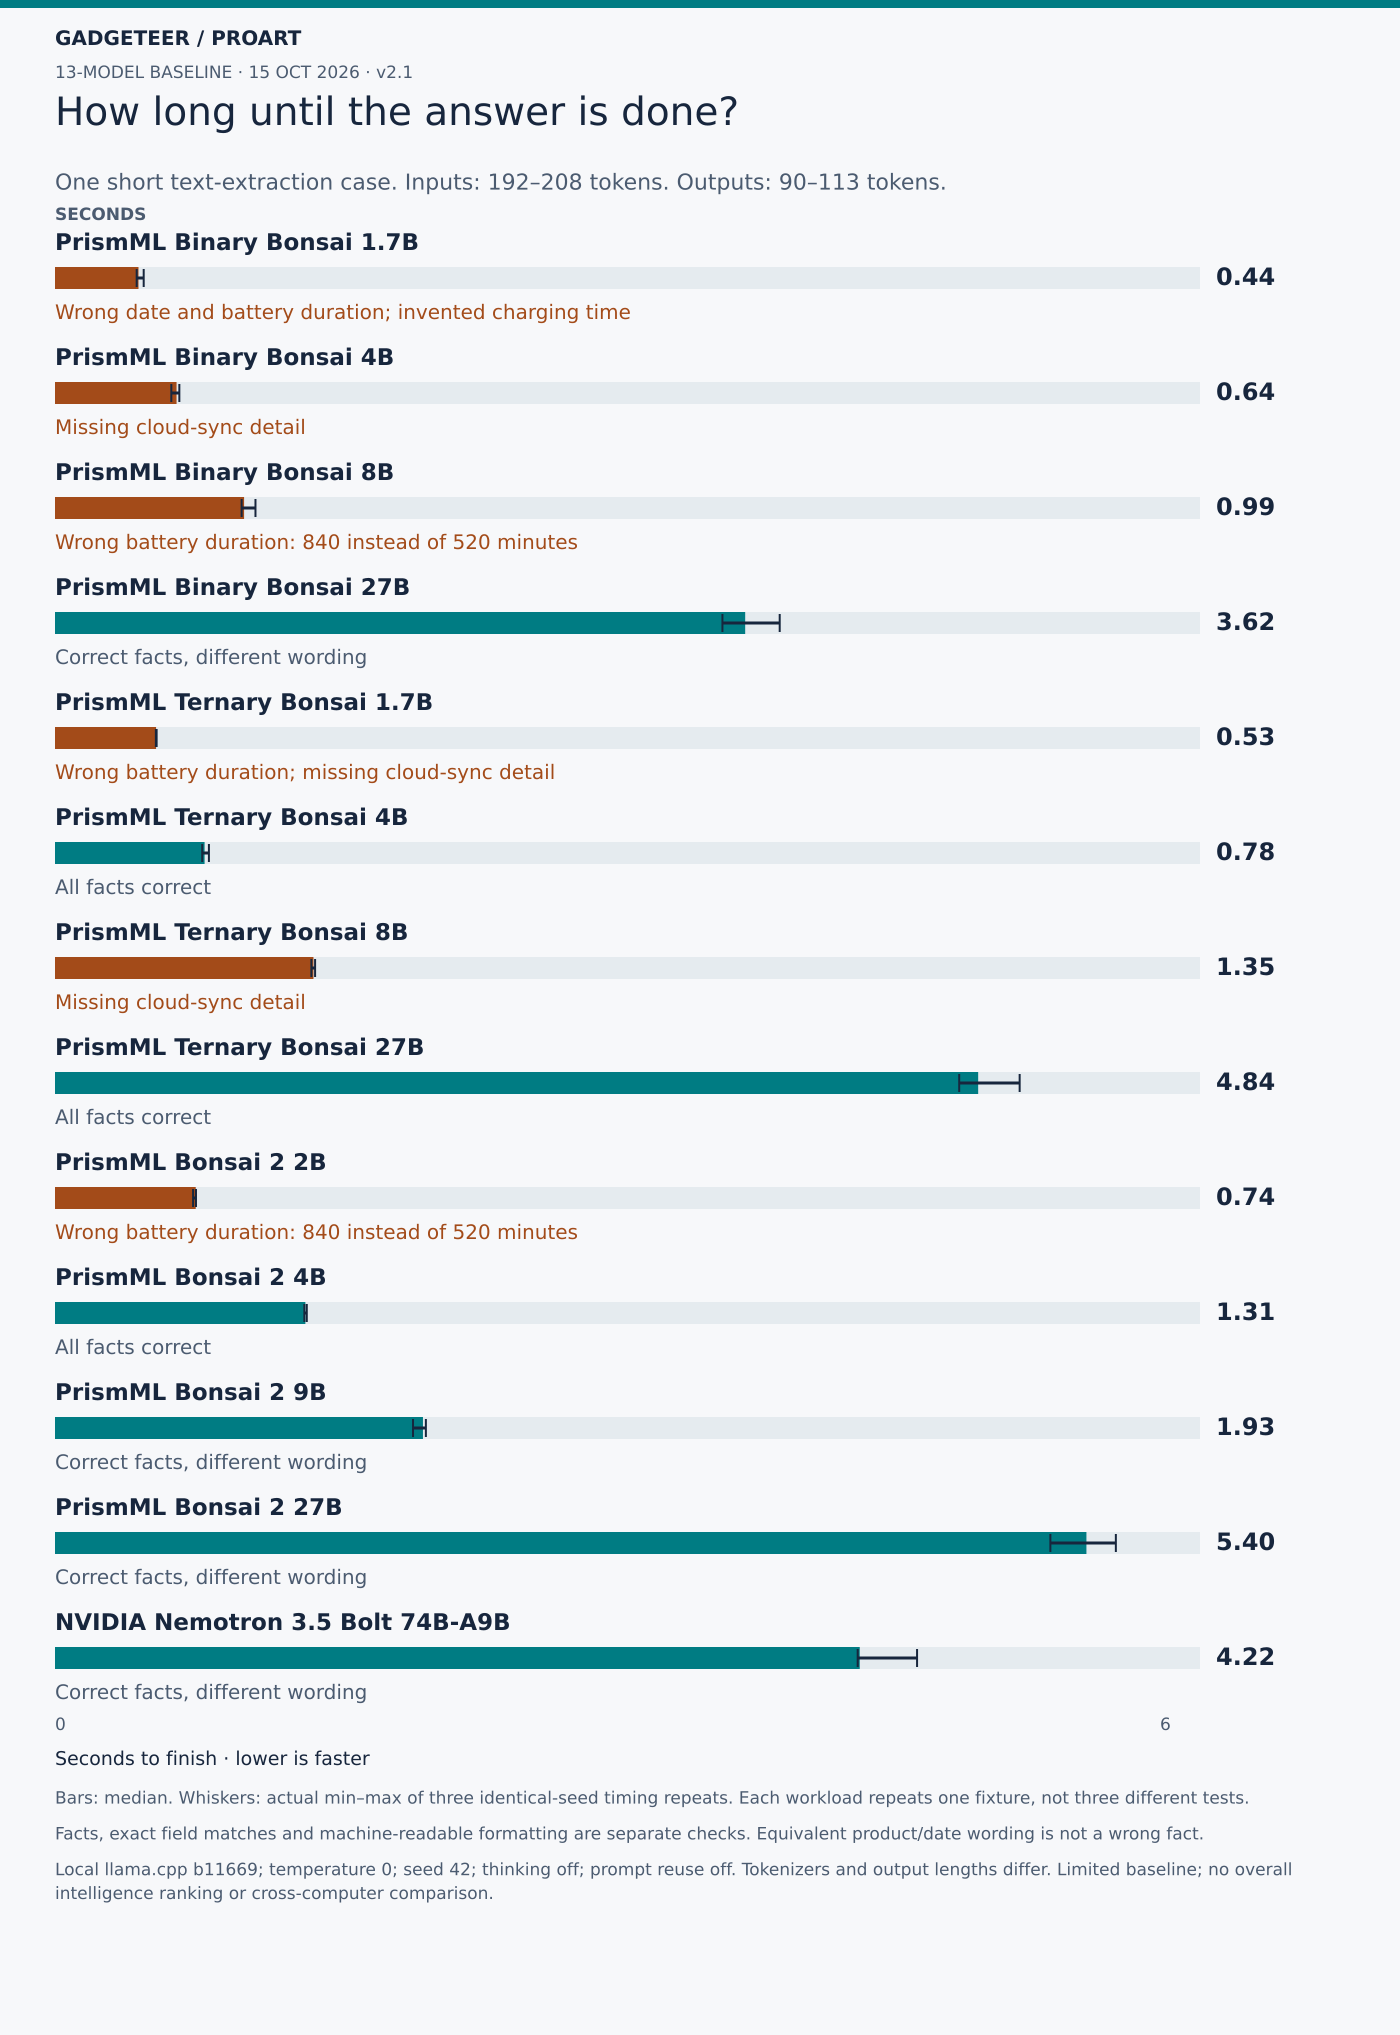
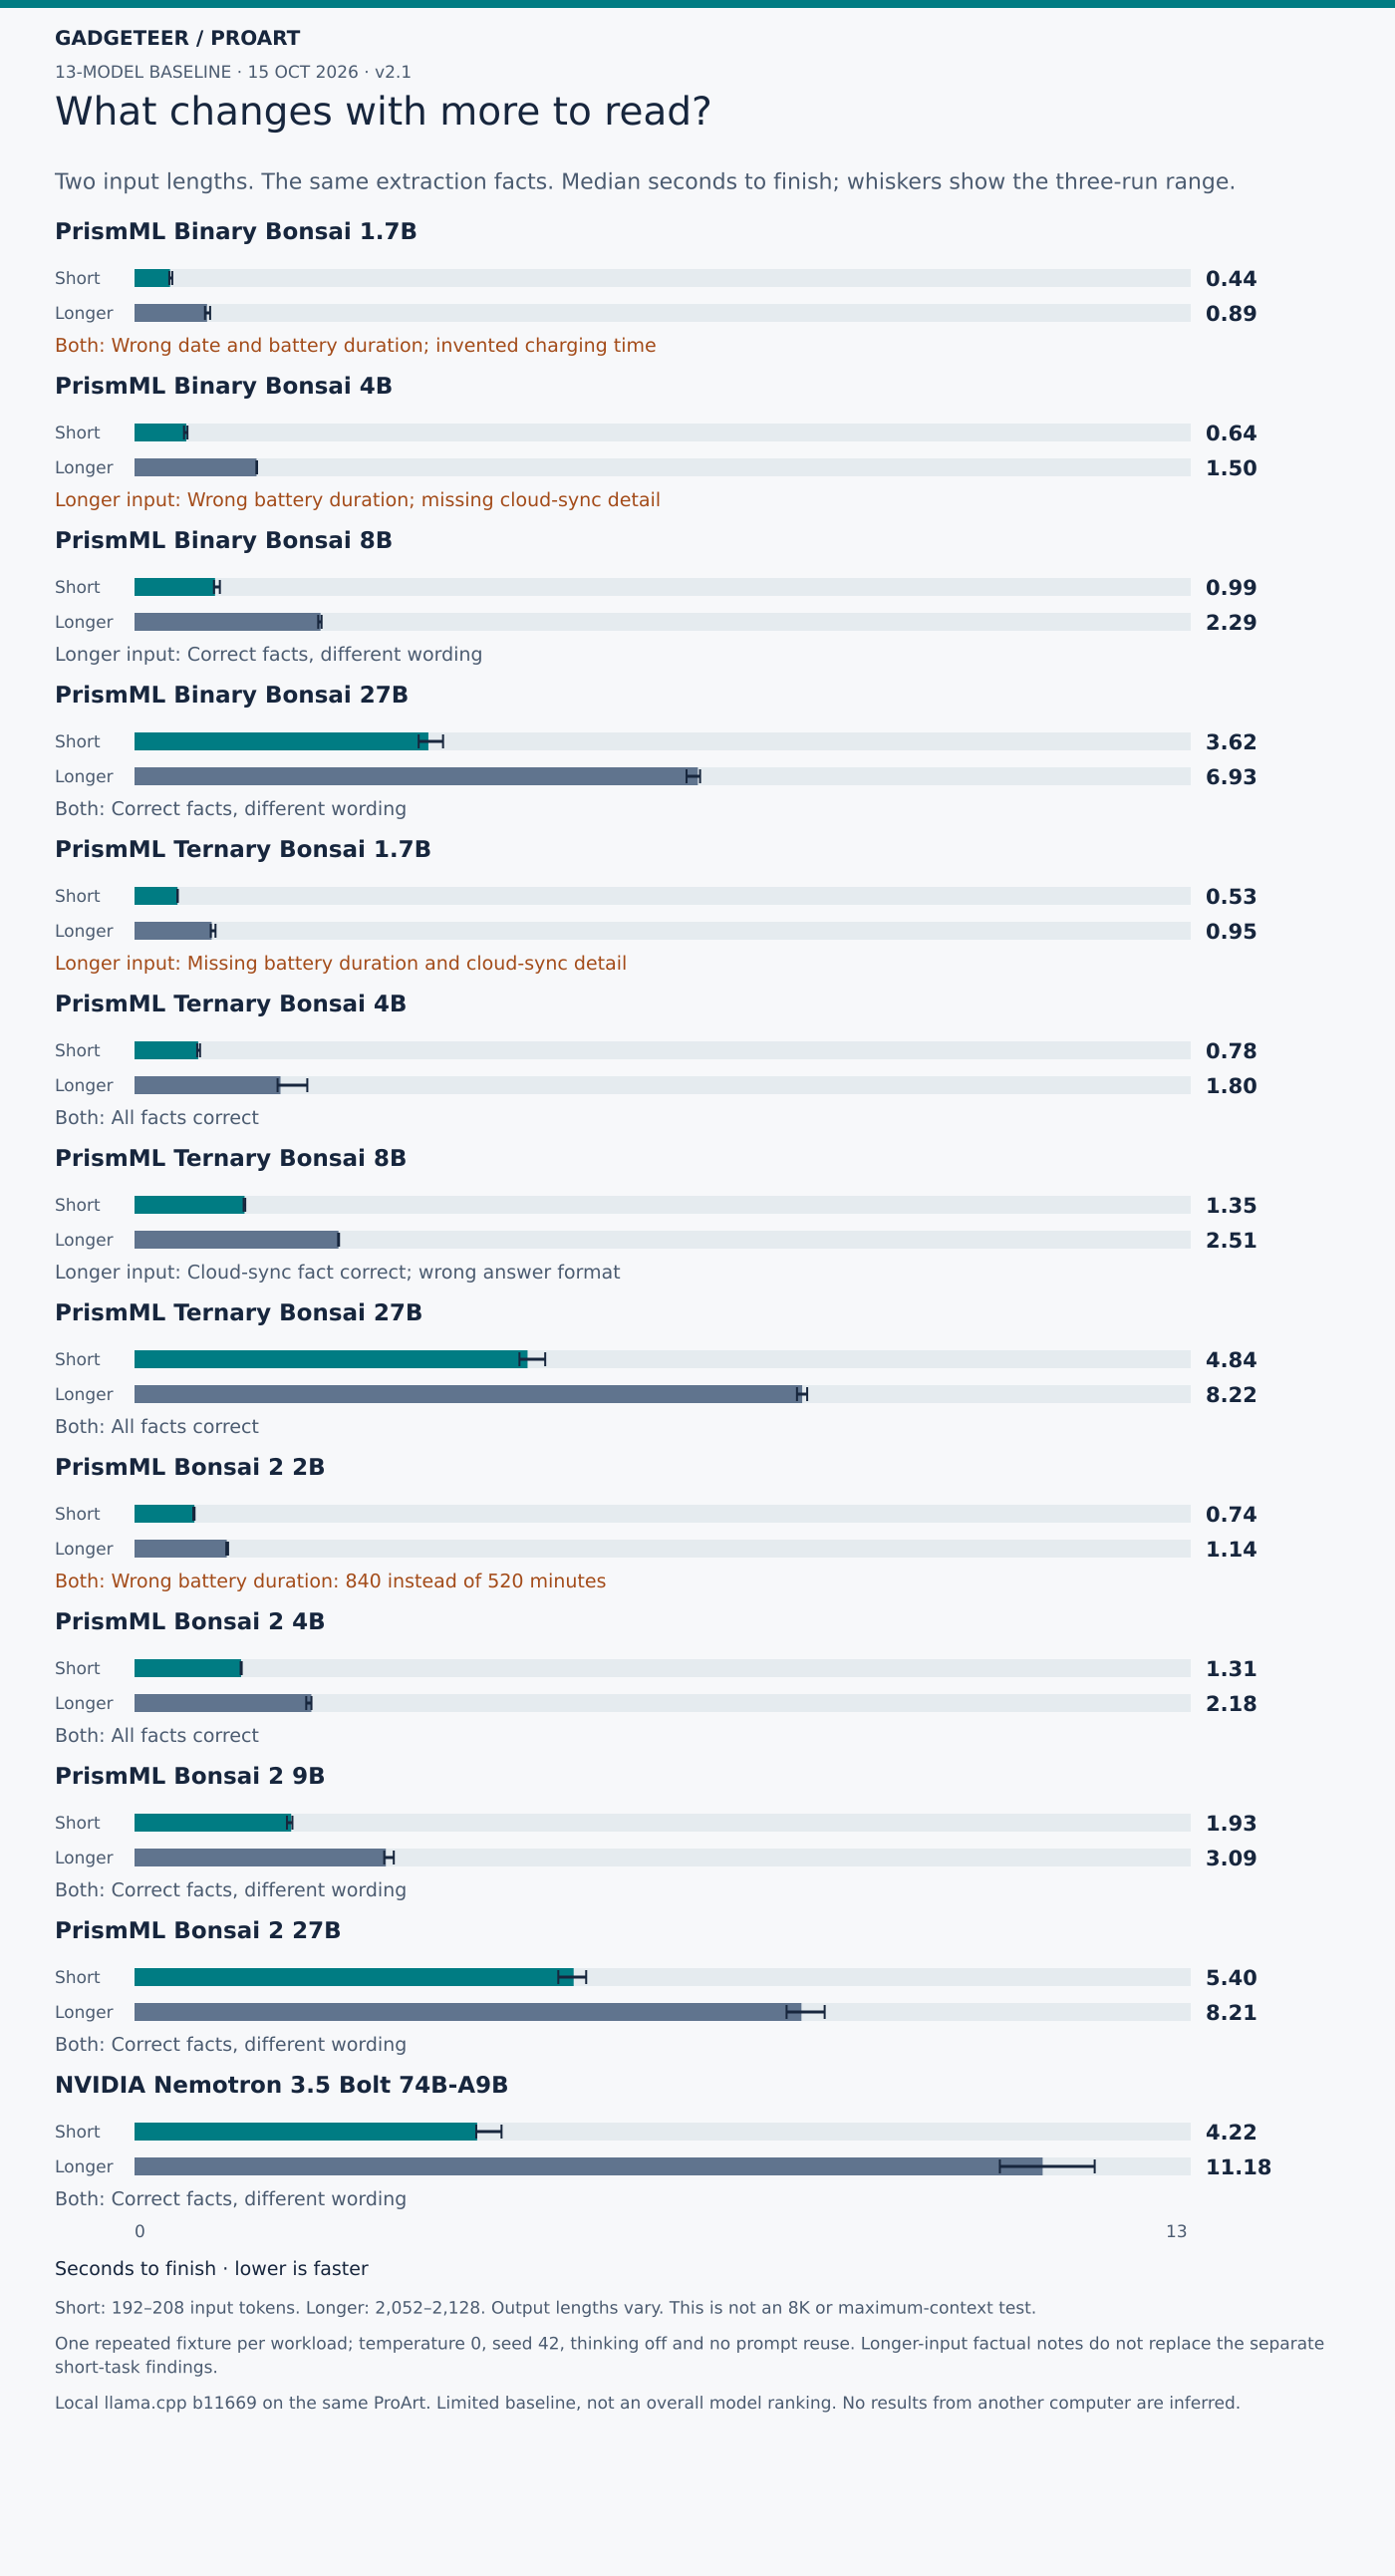
The smaller models could answer quickly, but some lost important facts. Earlier Binary Bonsai 1.7B finished the short extraction in a median 0.44 seconds, yet gave 1 November instead of 2 November, changed the battery result to 840 minutes and filled in a charging time of zero when no charging time was supplied. It also left the known optional-cloud detail unanswered. Bonsai 2 2B took 0.74 seconds and also returned 840 minutes.
There were small models that handled this brief correctly. Earlier Ternary Bonsai 4B matched all ten expected fields in 0.78 seconds, and Bonsai 2 4B did so in 1.31 seconds. Bolt took 4.22 seconds and returned the correct facts, although its product wording and date format differed from the exact answer template.
A writing workflow needs both accurate facts and usable formatting. Bolt’s “FieldNote Mini recorder” and “November 2, 2026” describe the same product and date as the expected “FieldNote Mini” and “2026-11-02”. That explains its eight-out-of-ten exact-field result: those two differences aren’t wrong product facts. The separate content check accepts those two equivalent forms. It doesn’t turn 840 minutes into 520 or fill in a fact the model missed.
Formatting can still affect compatibility when an answer goes straight into another program. Several image-test responses put the JSON inside Markdown fences. The facts can be readable to a person while the unmodified response fails a strict JSON parser. The results distinguish those formatting failures, wrong values and missing known facts, rather than folding everything into one “accuracy” percentage.
For this short extraction, the useful result is that earlier Ternary Bonsai 4B and Bonsai 2 4B both produced the complete expected answer promptly. Bolt also preserved the facts. The fast but wrong responses show why I’d keep a source check in the workflow before using an extracted specification in an article.
Reading the timing charts
There are three different questions behind the speed numbers:
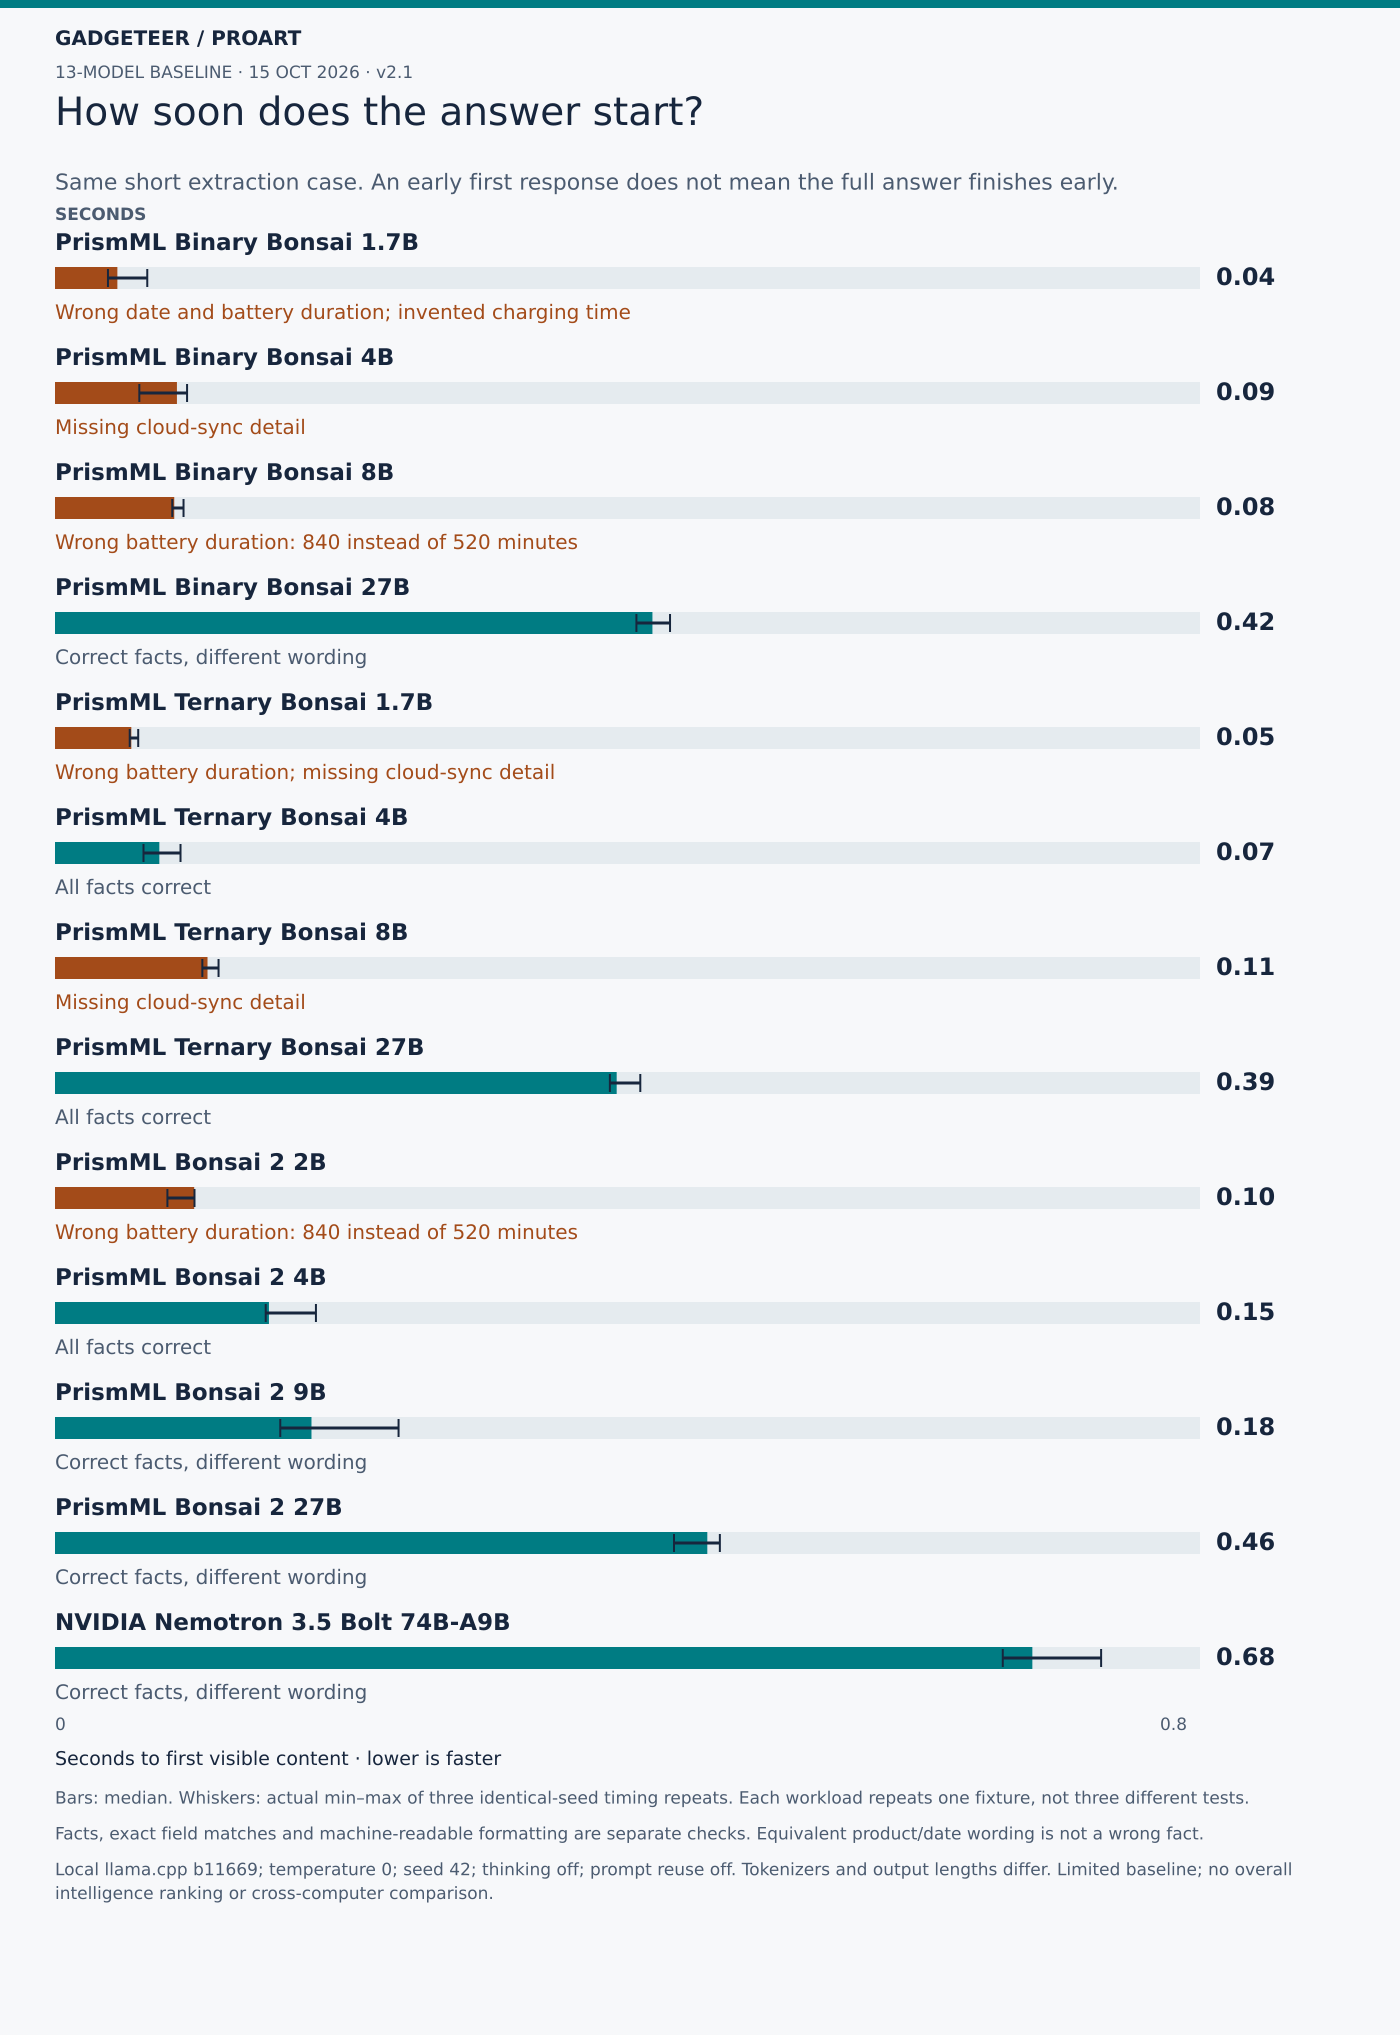
- How long before the answer starts? First-content time measures the wait from sending the request until the first non-empty piece of the answer arrives. It includes processing the input and beginning the response. It doesn’t mean the answer is finished or correct.
- How long until the full answer is back? Completion time runs from sending the request until the response stream ends. For this extraction job, lower seconds means less waiting for the returned answer. Read it alongside the correctness note.
- How quickly does text come out? Generation speed measures tokens per second during the server’s decoding phase, after prompt processing. A token is a chunk of text, which can be a word, part of a word or punctuation. Higher tokens per second means faster generation under these settings, rather than more correct answers per second.
For example, Bolt began its short extraction response after a median 0.68 seconds and finished after 4.22 seconds. Earlier Ternary Bonsai 4B began after 0.073 seconds and finished after 0.78 seconds. Bolt returned 110 tokens; the earlier Ternary 4B returned 90. Both got the facts right, but the responses weren’t the same length. The identical short question also became 208 input tokens for Bolt and 192 for the Bonsai models after their chat formatting. This is why completion time, answer length and token rate belong together.
The generation-speed chart uses a different prompt: an 800-word fictional field report about a librarian organising imaginary travel journals. Every run deliberately stopped at 256 output tokens. That gives a fixed-length generation probe; writing quality wasn’t scored on the unfinished report. On that probe, earlier Binary Bonsai 1.7B generated a median 256.60 tokens per second, earlier Ternary Bonsai 4B 119.48, Bonsai 2 4B 93.70 and Bolt 27.83. Those figures come from the report prompt, not the ten-field extraction answer.
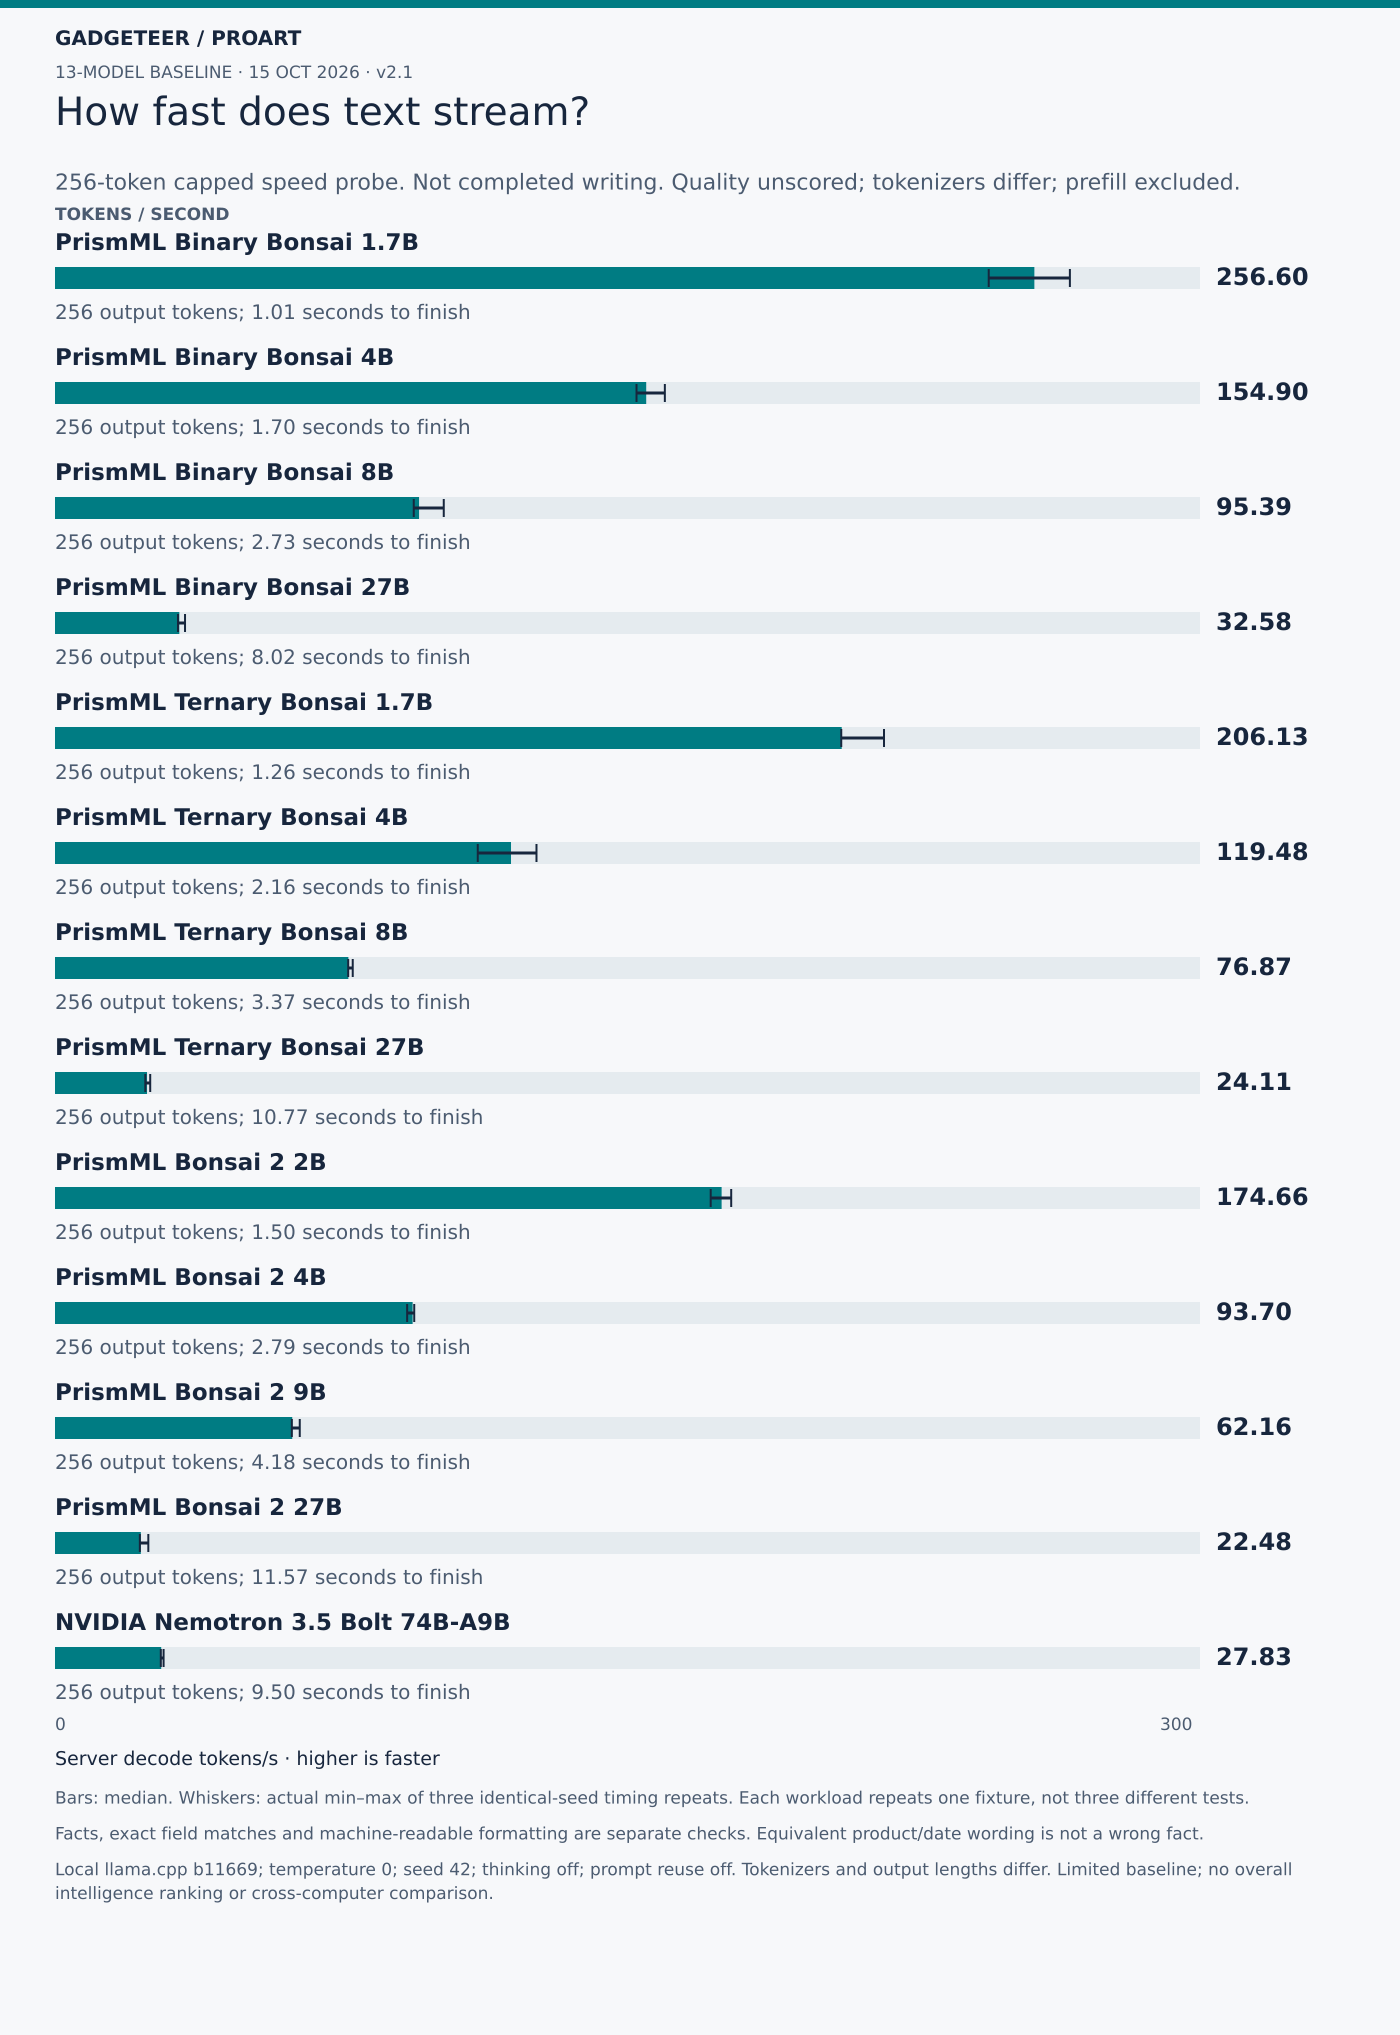
For generating an excerpt, the smaller models delivered more tokens per second in this setup. That helps describe how quickly a response streams onto the screen. The extraction results show why I wouldn’t choose an editorial assistant on that number alone: the fastest generator in this group also changed facts in the brief.
For readers comparing the calculations, server decode speed here is output tokens minus one, divided by the reported decode time in seconds. The first token is excluded from that numerator. It’s a different measurement from dividing all output tokens by total request time, which also includes the wait for the response to begin. The runtime’s own documentation likewise treats prompt processing and token generation as separate workloads. llama.cpp benchmark documentation.
Bigger isn’t always faster
For a small job, I don’t automatically want the biggest model. I want the answer quickly, and I want it to be right. In this test, some compact models pulled the facts from our brief quickly. Other fast models changed facts or filled in details that weren’t there. Saving a few seconds isn’t much help if I have to untangle the answer afterward.
Model size is only part of the story. The design of the model, how it’s stored and the software running it all affect speed. Our results show how those pieces worked together on this laptop; they don’t tell us which piece caused the difference. NVIDIA’s model details and Prism’s model details explain the different approaches.
My takeaway is to match the model to the job. A quick, accurate extraction is useful. Before trusting that same model with a longer brief, a calculation or an action on my behalf, I’d test that job too.
Did unrelated material change the answer?
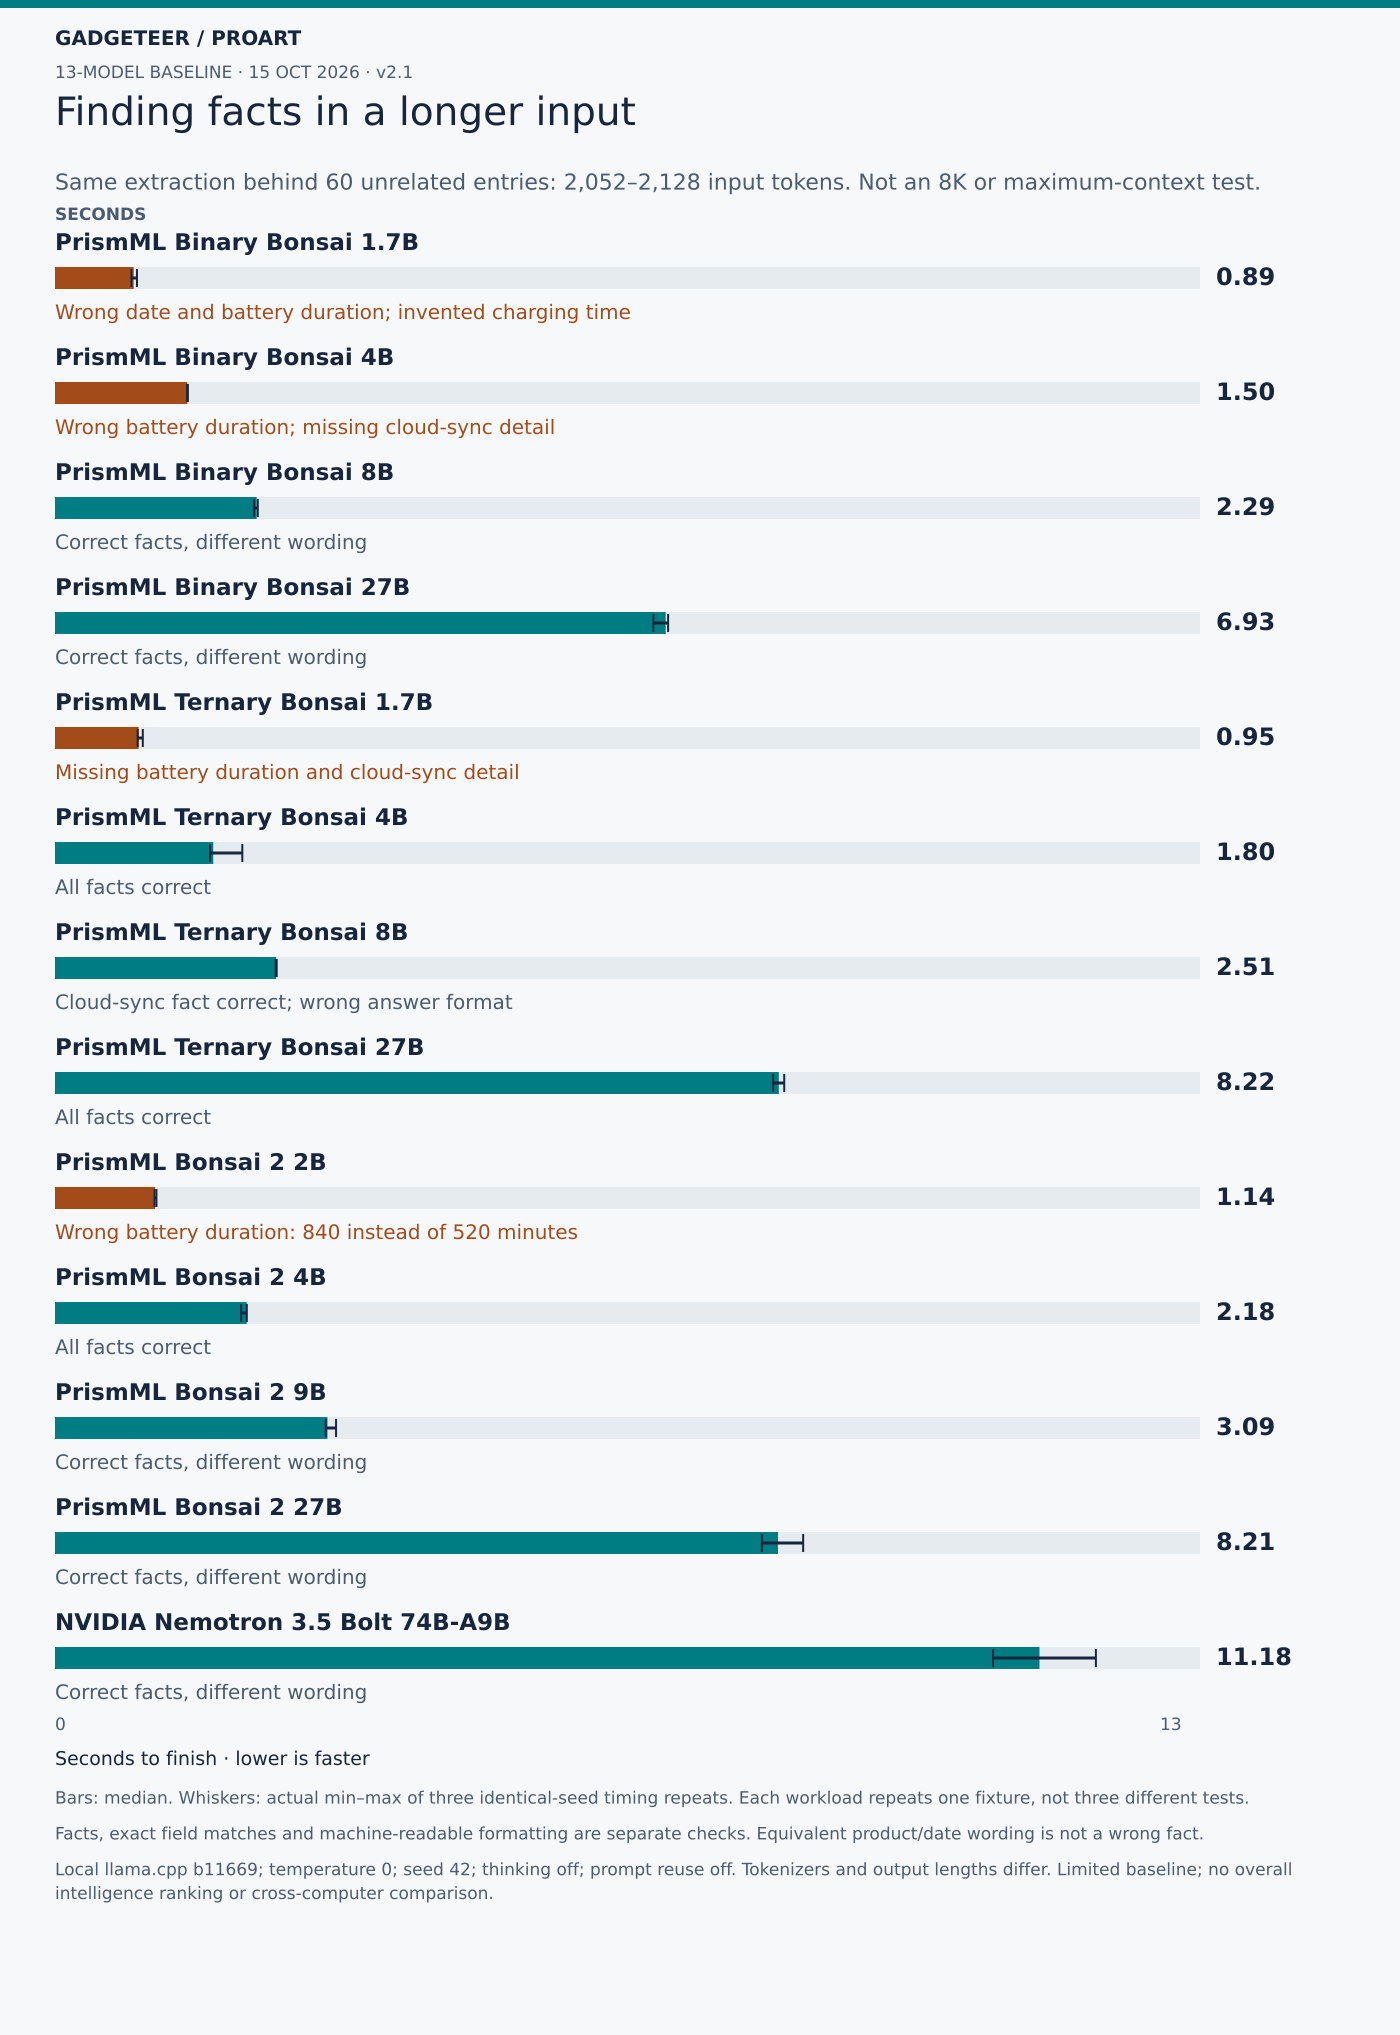
The longer extraction kept the useful brief at the beginning, added 60 unrelated archive entries and put the question at the end. Earlier Ternary Bonsai 4B and 27B still matched all ten expected fields. Earlier Binary Bonsai 8B, which returned 840 minutes in the short test, returned the correct duration with the longer input. Earlier Binary Bonsai 4B went the other way: its longer-input answer gave 484 minutes.
That makes this a useful answer-stability check as well as a timing comparison. Some answers changed even though the relevant facts hadn’t. For a longer source packet, I’d check the extracted figures against the original material rather than assume that a short-prompt result carries over unchanged.
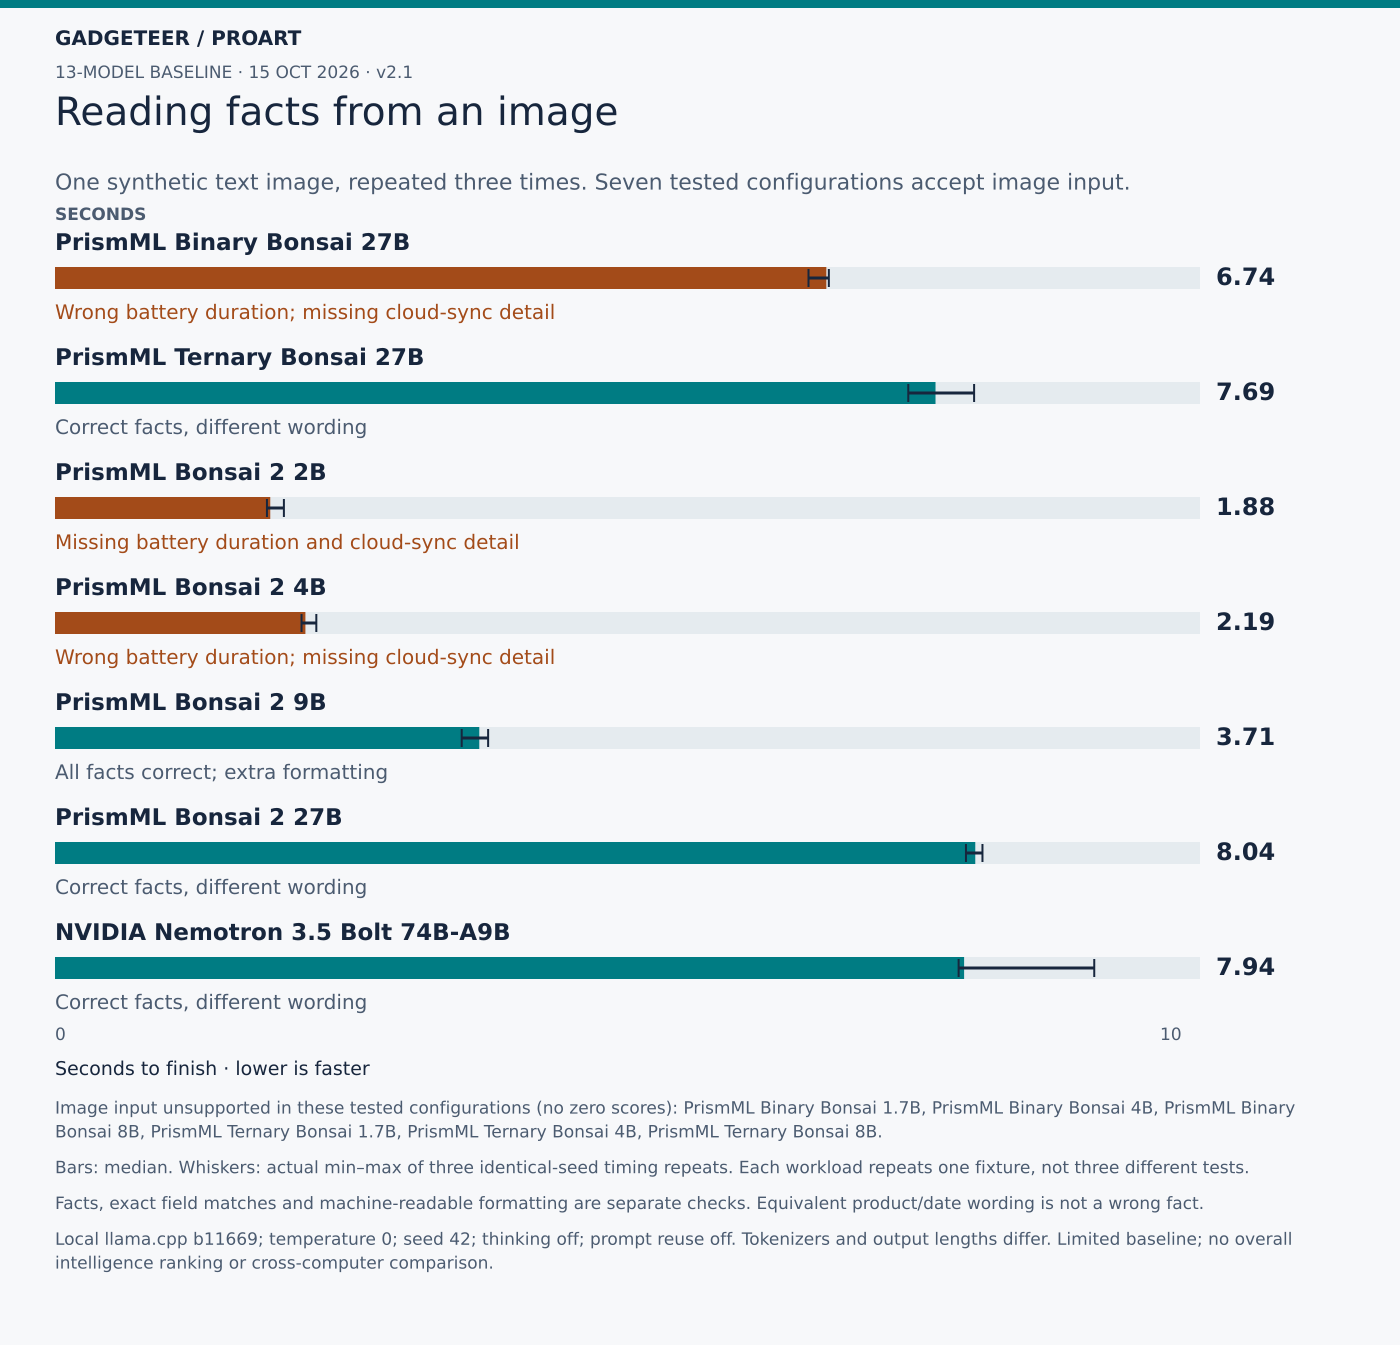
What changed when the input was an image?
Image reading brought its own problems. Bonsai 2 4B and the earlier Binary Bonsai 27B both returned 480 minutes rather than 520 and failed to retain the fact that cloud sync was optional. Several models wrapped their answers in Markdown formatting. Getting the text version right wasn’t a guarantee that the same model would read a picture of it correctly, and a larger model wasn’t immune to mistakes.
The second image was deliberately simple: a red circle on the left and a blue square on the right. Models had to name the shapes, colours, positions and total count. That checks a small, clear visual task alongside the text-heavy image; it doesn’t stand in for reading a dense chart or a photograph of a complicated scene.
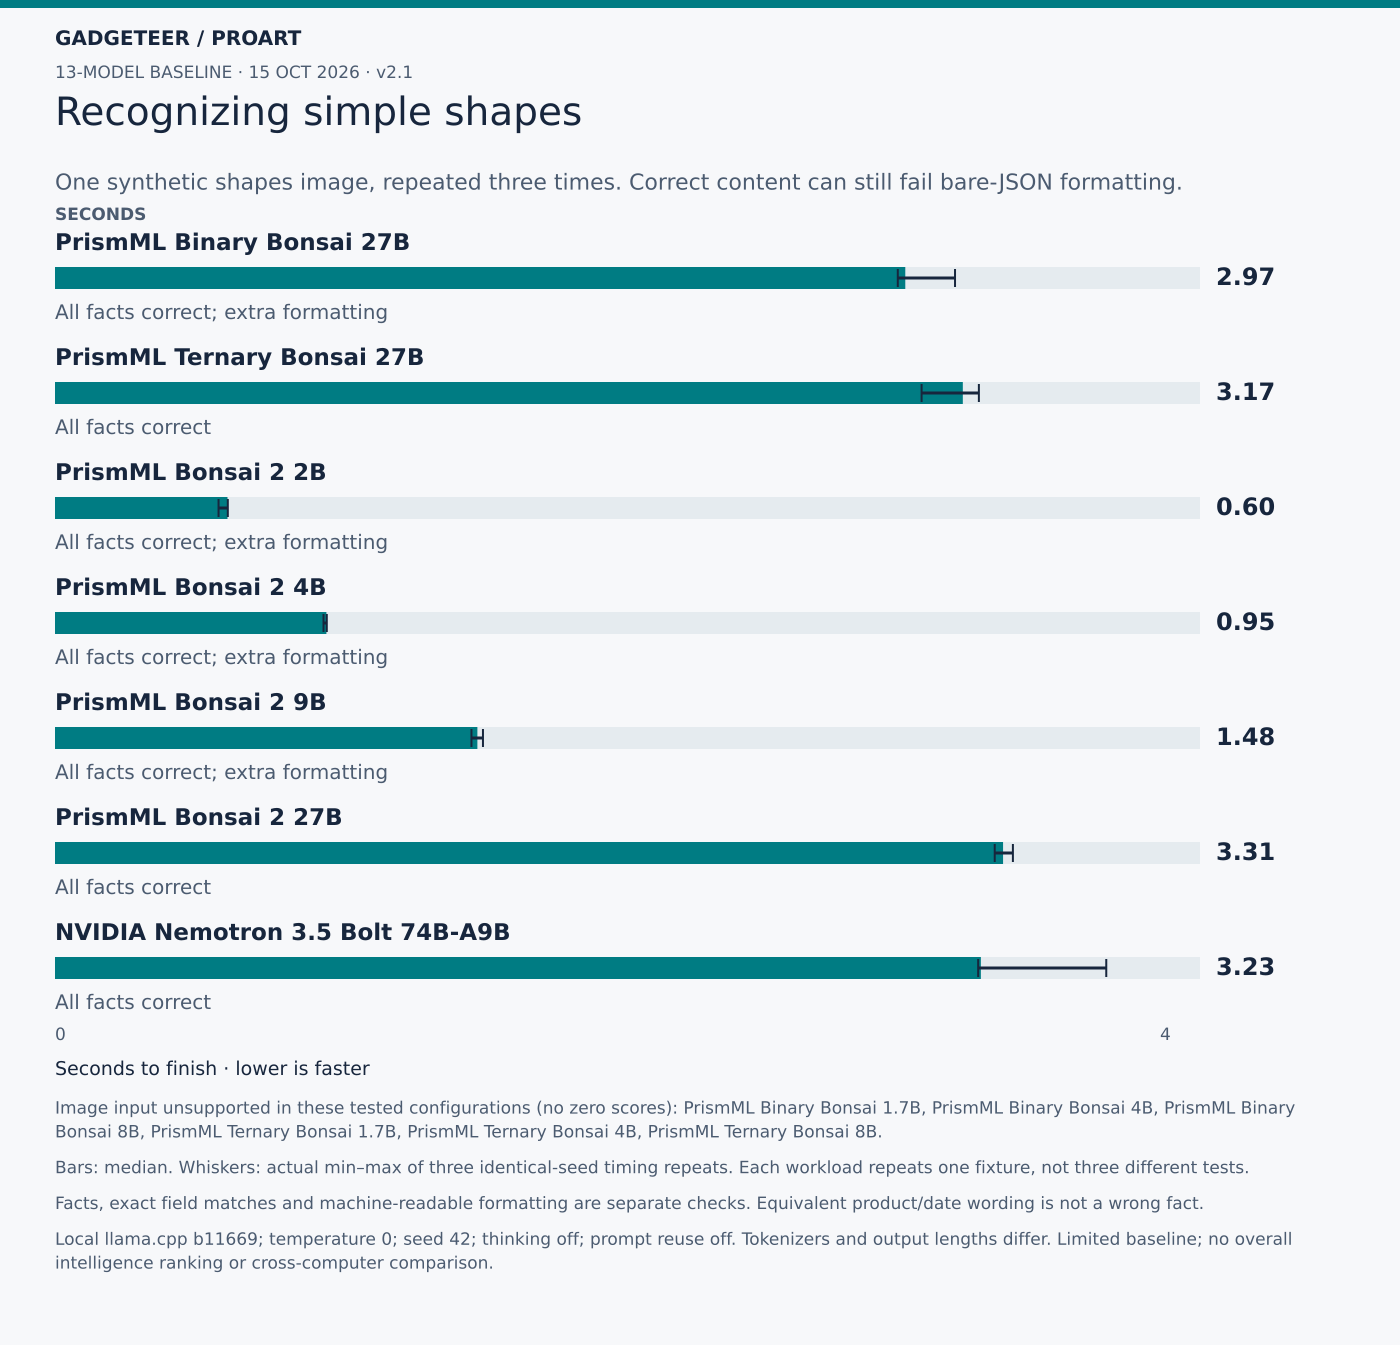
The practical takeaway from the image tests is to check image-extracted numbers and missing fields against the image itself. A model can read the shapes correctly, or extract the text brief correctly, and still lose an important detail when the brief arrives as a picture.
The settings behind this round
- What we tested: 159 timed responses and 21 readiness checks across the text and image tasks.
- Each workload used the same input three times, with temperature 0 and seed 42. Charts show the median timing and fastest-to-slowest range. Three repeats show timing variation, not three different accuracy examples.
- The longer extraction added 60 irrelevant archive entries to the same brief. Actual input was 2,052–2,128 tokens, depending on the model; 8,192 tokens was the configured context limit.
- What the clock includes: the response after the model was loaded and had answered a readiness request. Model-loading time is excluded.
- Prompt reuse was disabled, and every request reported zero reused prompt tokens. The operating system’s file cache during loading wasn’t controlled.
- Text chat formatting and the separate tokenizer check happened before timing started.
- How the laptop ran: everyday background apps stayed open, Windows used its recorded Standard power scheme, and test order wasn’t randomized. Small timing differences shouldn’t carry a big conclusion.
- Technical setup: one loaded model and one request slot at a time, thinking disabled through the chat template, and no speculative draft model.
- Windows ARM64, CUDA 13.4 and llama.cpp b11669, commit 620d2225c.
- An 8,192-token context, q8_0 key/value cache, flash attention, batch size 512 and microbatch 128. Each image run used its matching projector.
What this means for my local-AI workflow
- Quick jobs: some small models returned the requested facts in under two seconds on our short extraction test. That’s a useful starting point for pulling details from a brief.
- Longer jobs: Qwen took about 12 seconds to start answering our 8K-input speed test and about 85 seconds total to generate 1,024 tokens. Full 32K-input summaries took about 3.4 minutes. I’d send those jobs off and come back to them. These were different tasks, not a head-to-head model ranking.
- What I’d still check: Qwen got the inventory fields and individual calculations right, but added business assumptions and got a combined total wrong in a separate task. I’d use its output as a draft and check it against the source. I wouldn’t put it in charge of an invoice or let it take actions unattended.
Our separate Llama 3.3 70B attempt stopped during loading when the safety monitor detected too little Windows commit headroom. It never generated an answer, so we have no speed or quality result for that configuration. A different setup could behave differently.
RTX Spark’s graphics get their own spotlight
The GPU is a big part of why I’m excited about this machine. It runs my local models, and I also want to see what it can bring to creative work. Our first graphics-compute result gives me something concrete to work with: 133,827 in Geekbench 6.7.1 OpenCL.
That’s just 2.4% below one RTX 5070 Laptop result of 137,154. It also comes in about 15–18% above two RTX 5060 Laptop results of 116,378 and 113,104. Seeing the ProArt land that close to that 5070 result is encouraging.
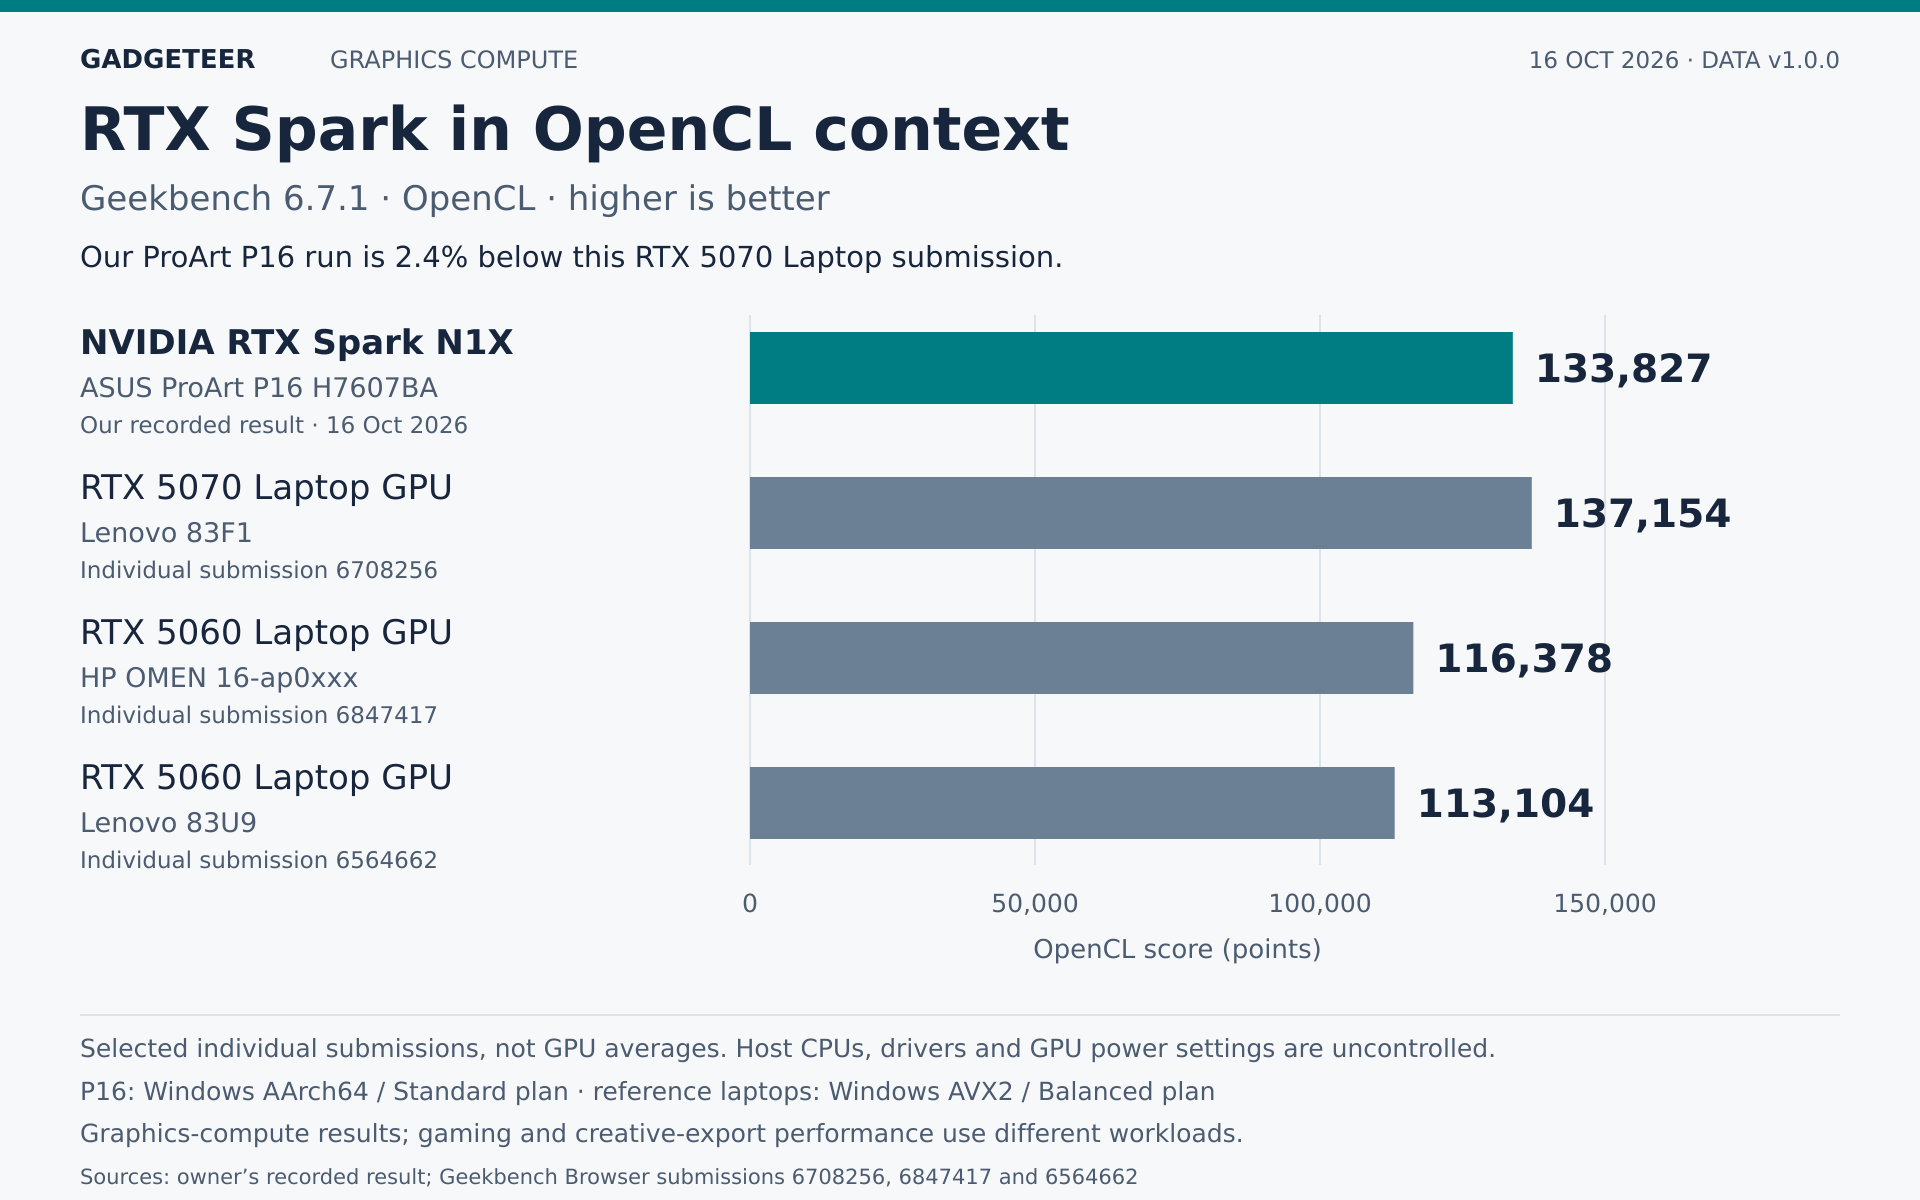
These are individual submissions using the same Geekbench version and OpenCL test, with different laptop power limits, drivers and processors. They give this result context; they don’t establish matching game frame rates, ray tracing or export times. For the local-AI jobs I actually ran, the earlier timing charts show what the wait looked like.
CPU performance in everyday context
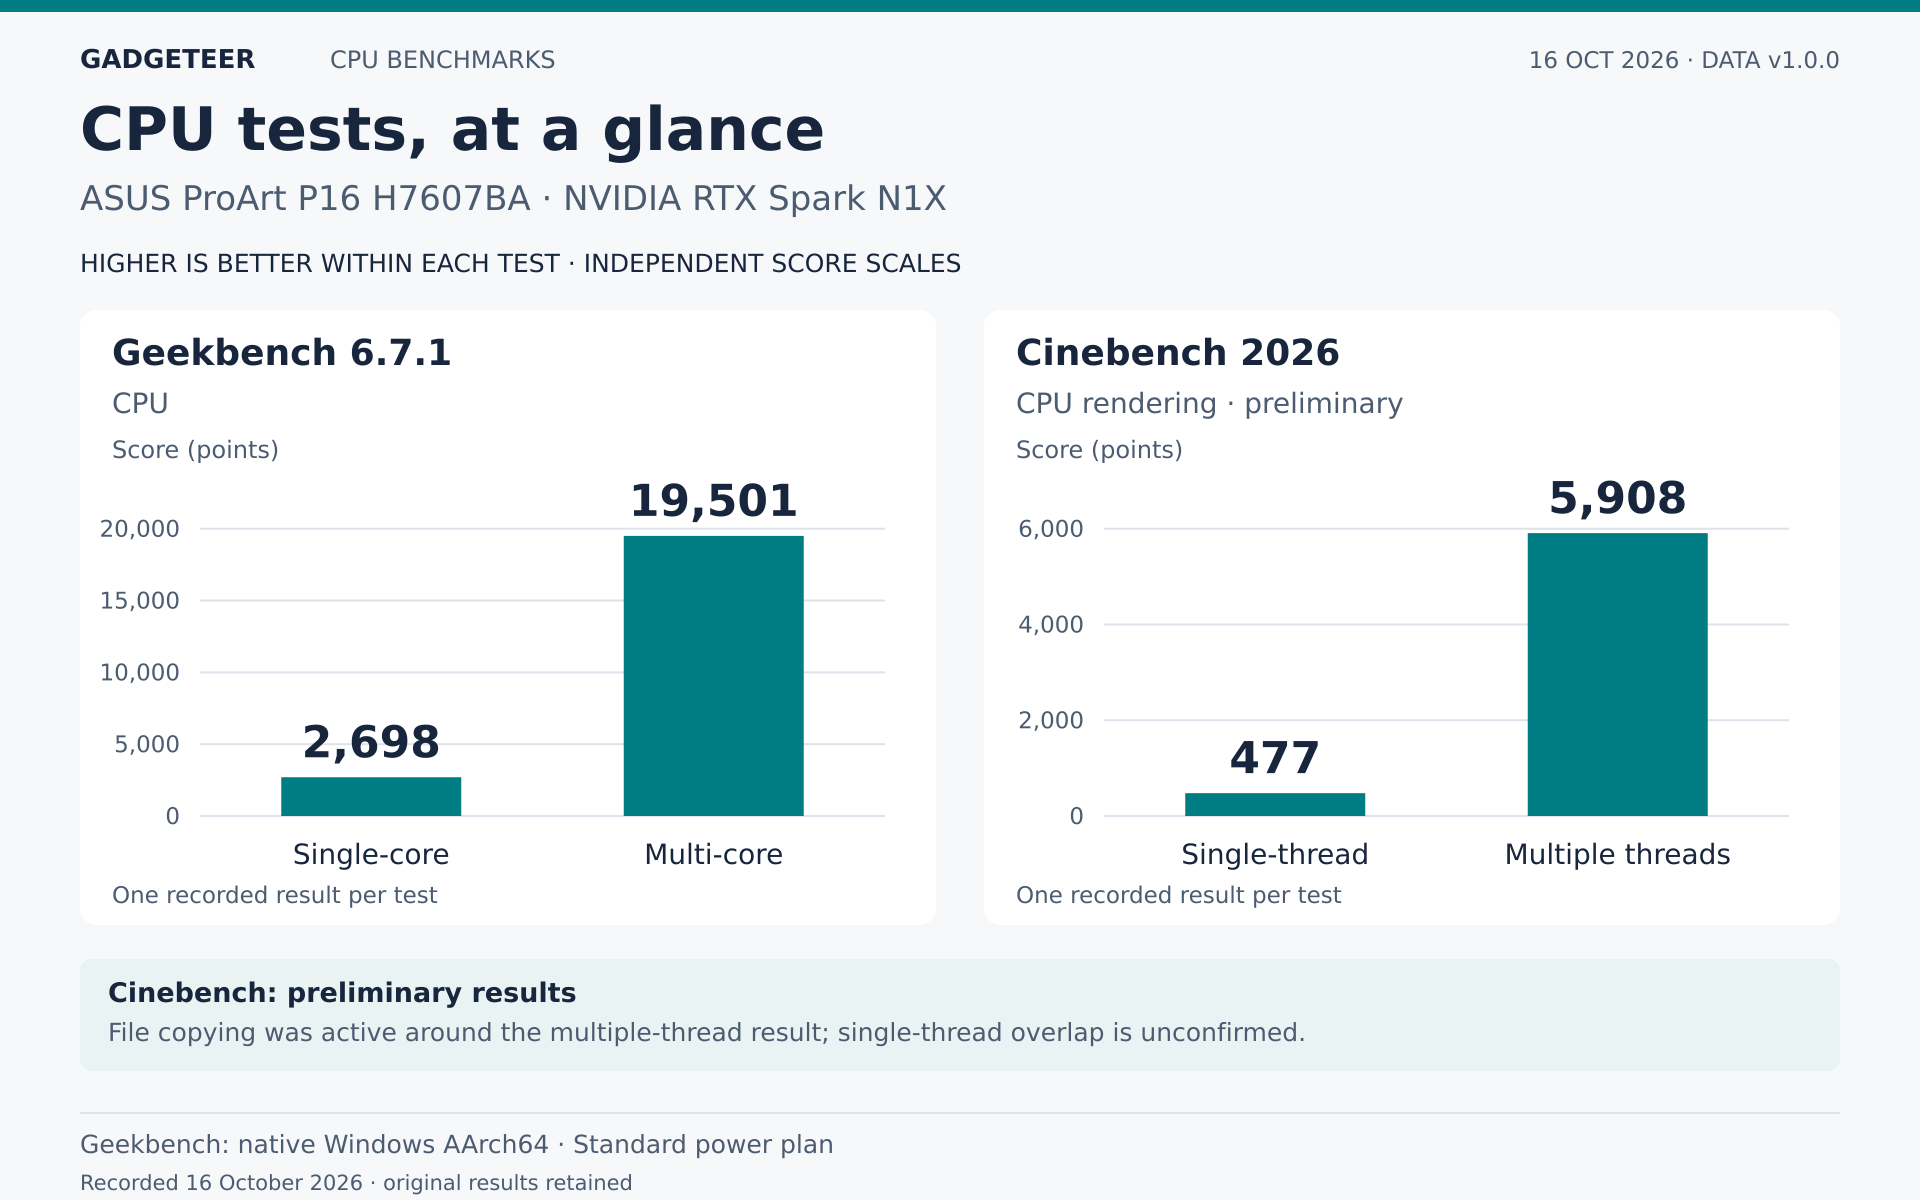
Photo work, exports and moving files still fill much of my day, so I also checked CPU and storage performance. Geekbench 6.7.1 for Windows ARM64 returned 2,698 single-core and 19,501 multi-core, with the Windows power plan recorded as Standard. The stronger showing is in parallel work, though the advantage depends on the job.
For context, three individual Geekbench 6.7.1 submissions from a Surface Laptop 7 with Snapdragon X Elite, ROG Zephyrus G16 with Ryzen AI 9 HX 370 and Dell XPS 16 with Core Ultra X7 358H scored 14,158, 15,583 and 16,462 in multi-core. The ProArt’s result is about 18–38% higher than those particular runs, while its single-core score is about 5–8% lower. Those laptops used different power settings and native platform builds; these are reference points, not a controlled head-to-head test or model averages. A 16-inch M5 Pro MacBook Pro submission reached 4,279 single-core and 28,686 multi-core, ahead of this ProArt run in both. Results vary even within one model, so these examples don’t establish a stable ranking.
The individual tasks give me a more useful picture than the total alone. Against that Zephyrus result, the ProArt’s multi-core Clang compilation score was about 37% higher, but its object-removal score was about 27% lower. A higher overall score doesn’t mean every photo or video operation will finish sooner. The tests make parallel processing look promising, while the creative applications I actually use still need their own timed jobs.
Cinebench 2026 returned 5,908 points in multiple threads and 477 in single thread, with a displayed 12.39× ratio. File copying was still active around the multicore result; I haven’t confirmed whether it continued throughout the single-thread run. These are the first recorded results, with repeat runs and consistent power, cooling and background conditions still needed.
SSD speed changes with the workload
CrystalDiskMark 9.0.3 ARM64, set to three passes with a 1 GiB test file, recorded 7,330.57 MB/s reads and 6,511.18 MB/s writes in its queued sequential test. With one sequential request outstanding, those figures were 2,296.03 MB/s and 1,878.81 MB/s. The queue setting changes how much work the drive can handle at once, so the larger headline numbers aren’t a prediction for every file copy.
Small random transfers showed a different profile. At 4K Q32T1, reads reached 183.83 MB/s and writes 335.55 MB/s; at Q1T1, they were 42.34 MB/s and 86.44 MB/s. Those small-transfer results help round out the sequential figures for workloads that touch many separate files.
The SSD was fast in this short test. I paused the background file copy while measuring it. I haven’t yet tested whether it keeps that speed during a large, continuous transfer.
The first creative tests
The next question was whether my creative tools could turn that processing power into finished files. I started with two trials of each ArtCraft command-line job and two ComfyUI image generations. All eight ArtCraft outputs and both ComfyUI images passed file-integrity and image-decoding checks.
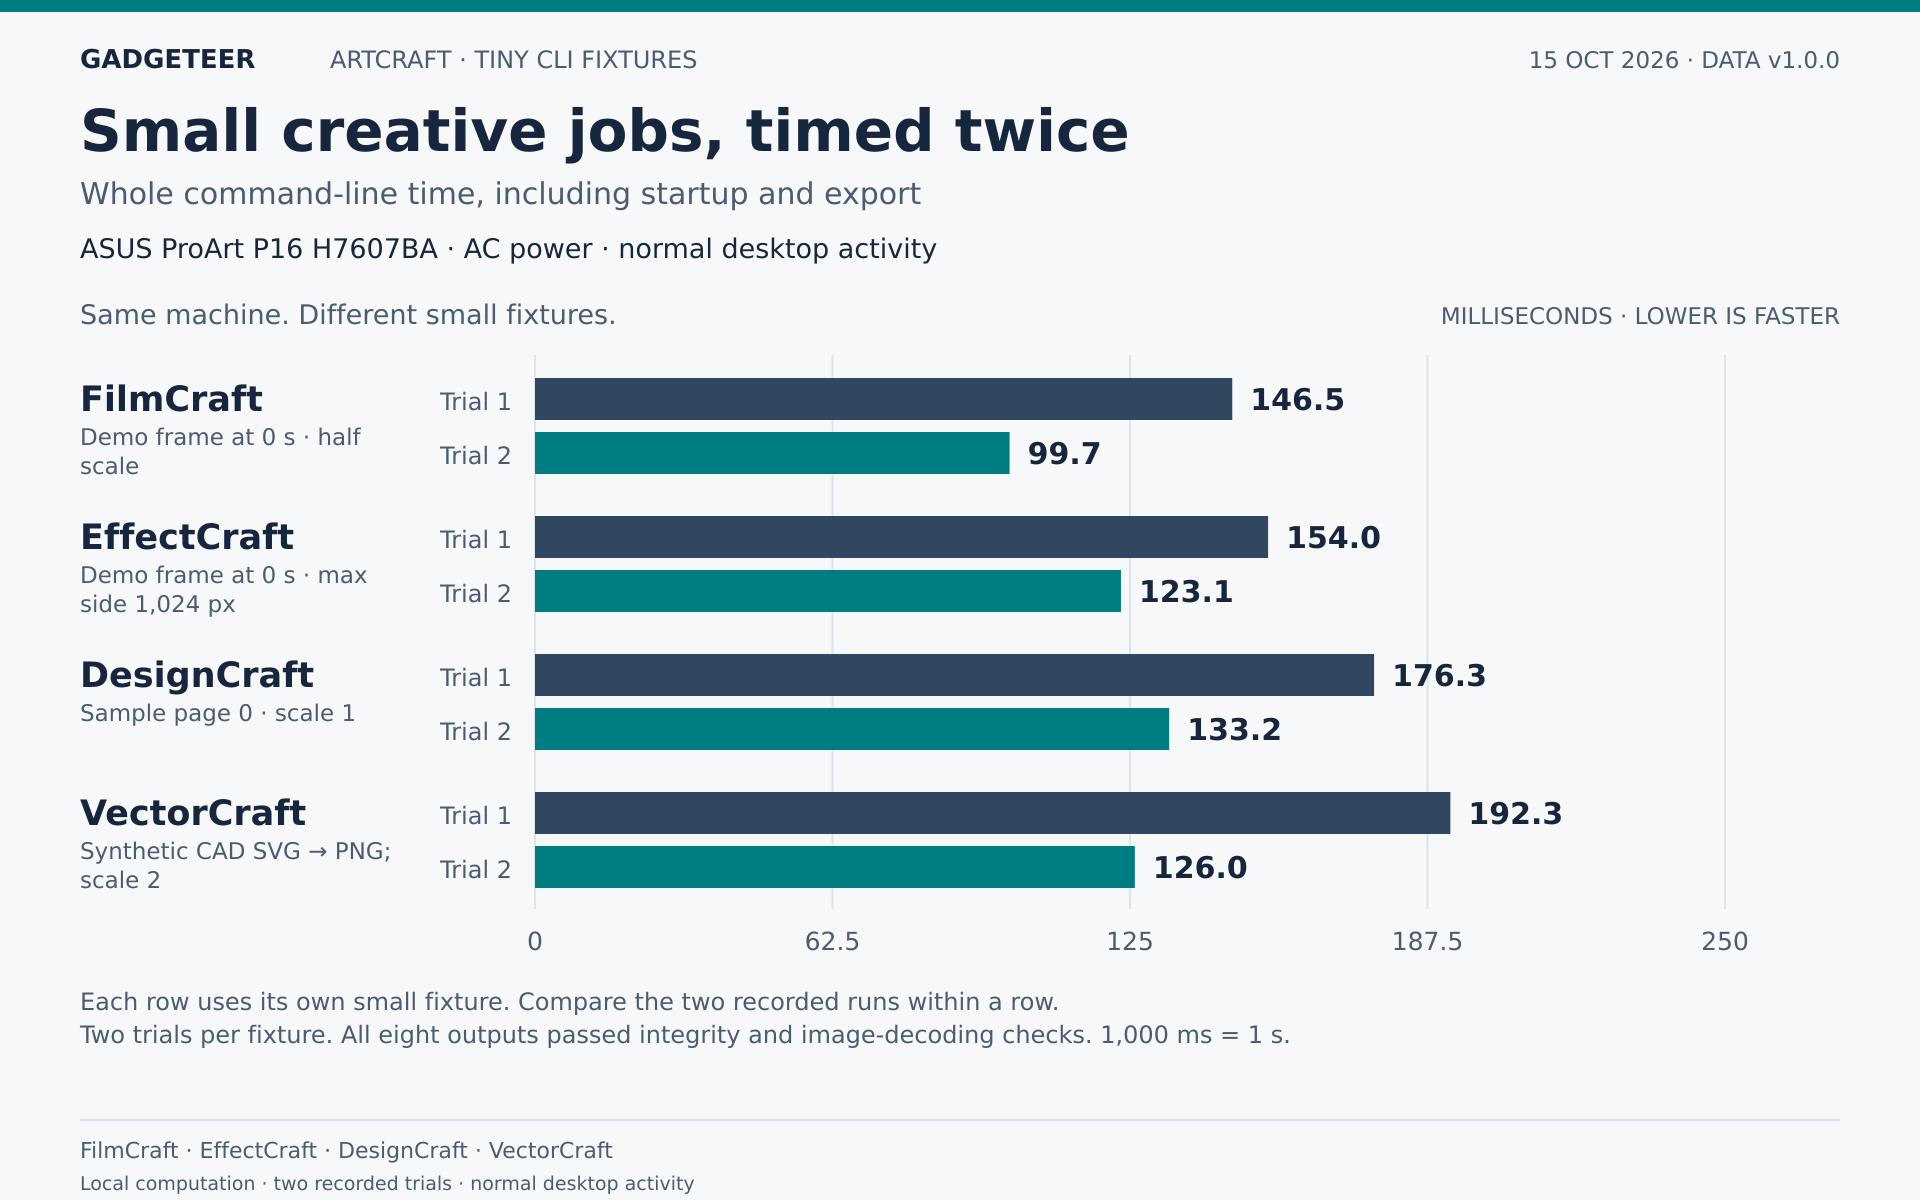
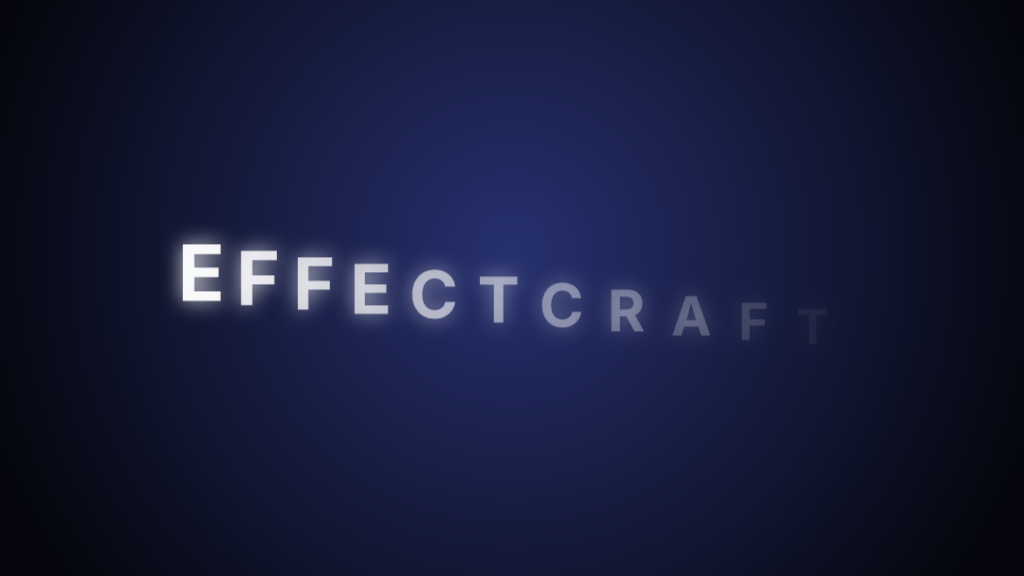
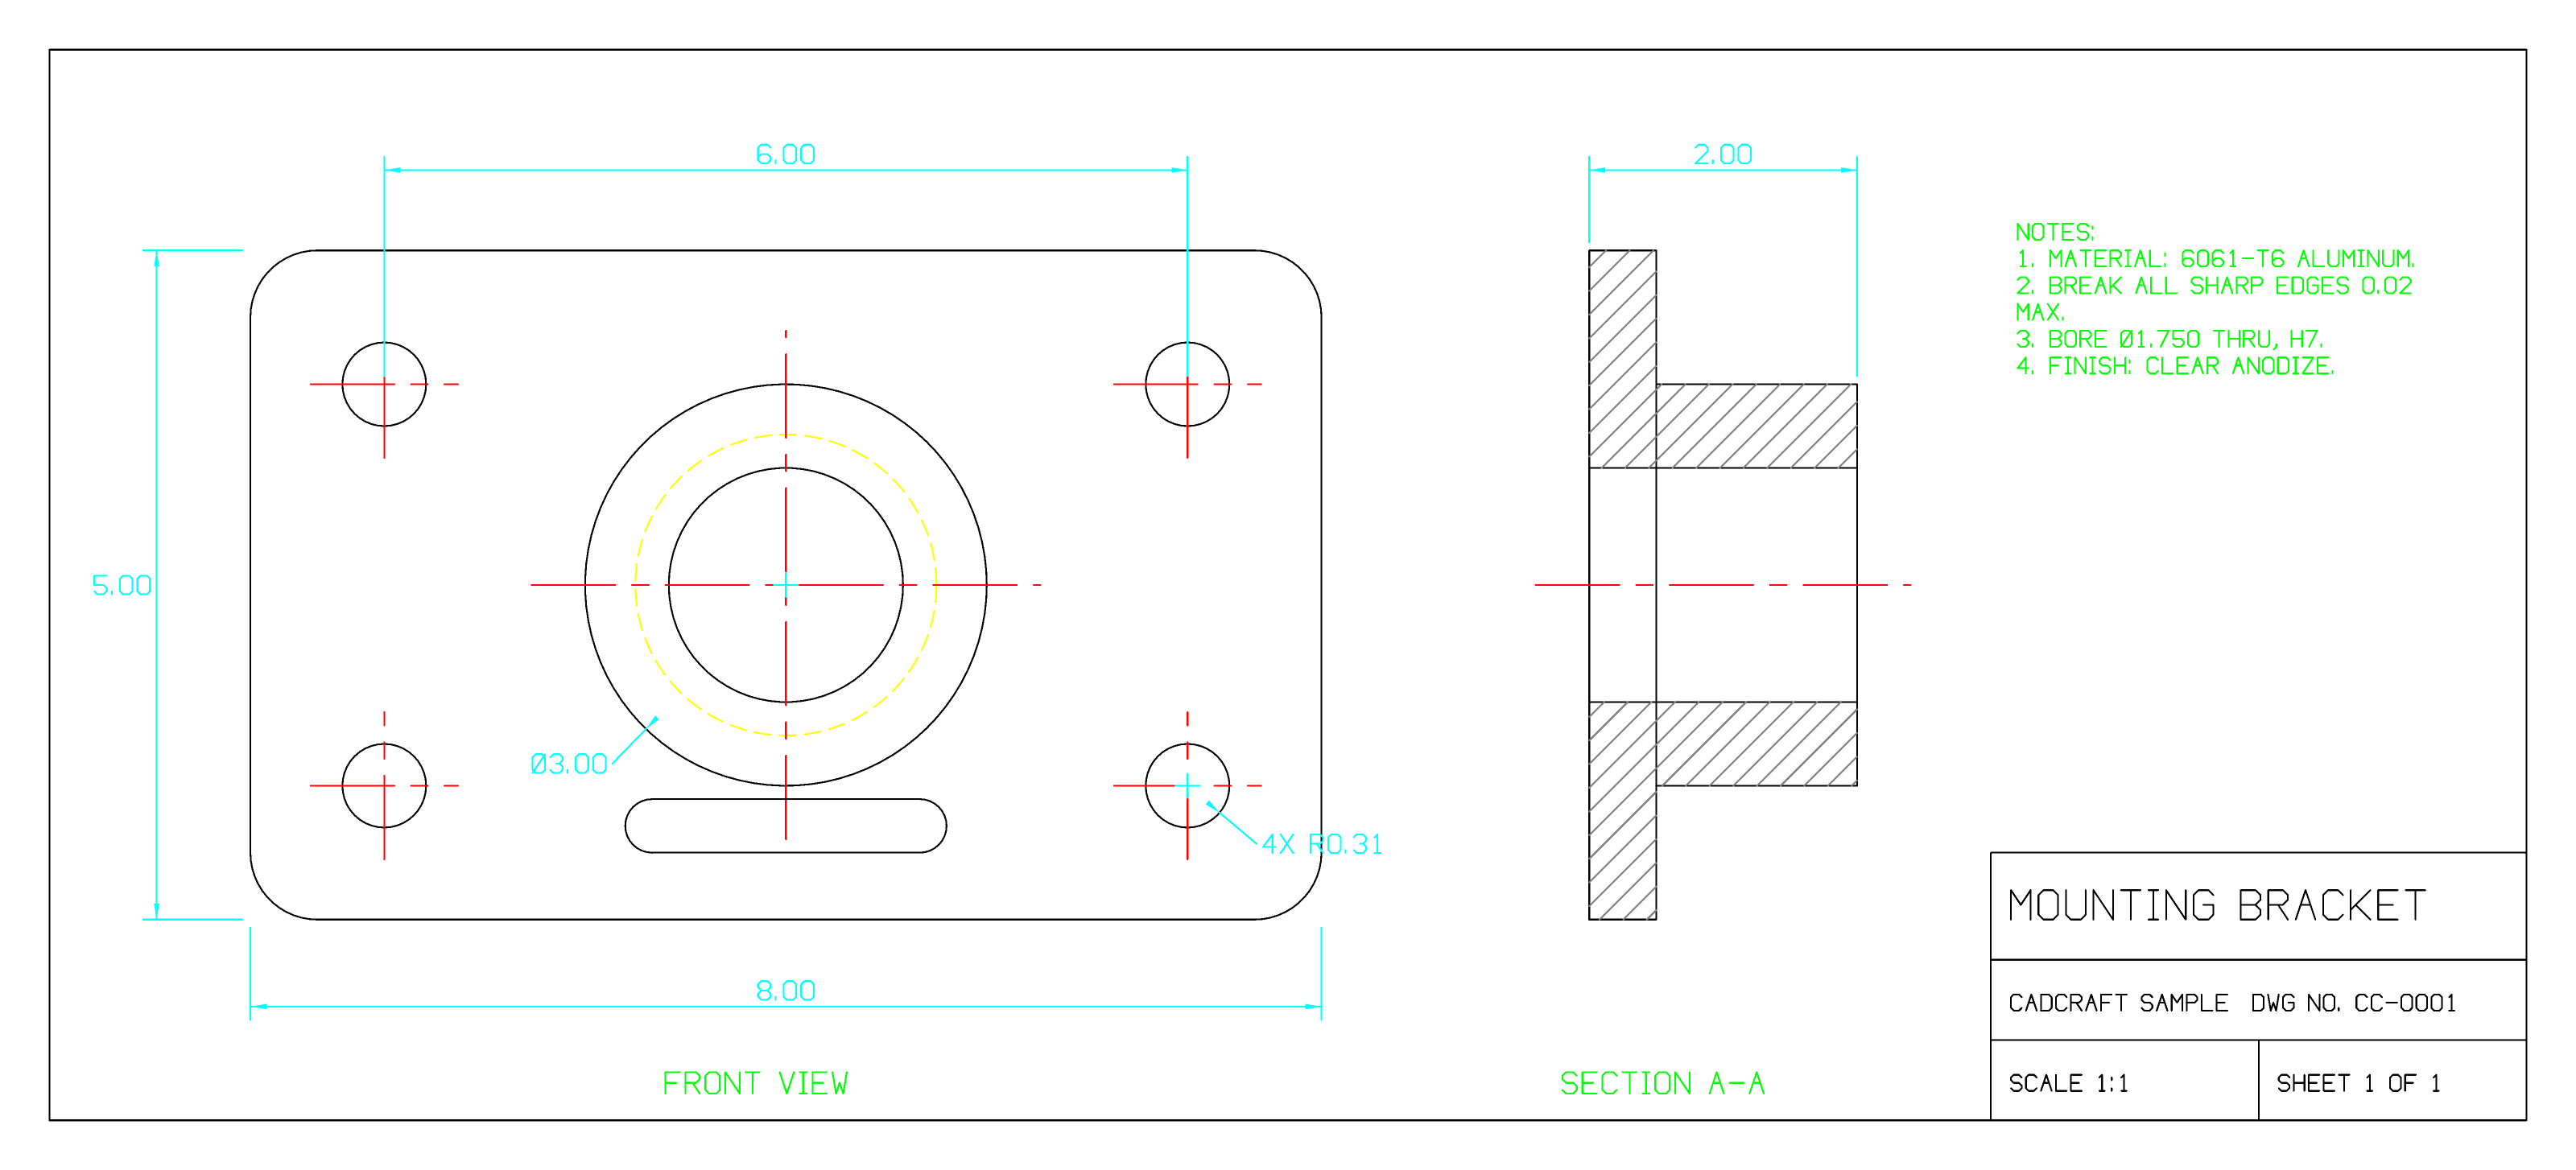
For ArtCraft, I used FilmCraft’s demo frame at time zero and half scale; EffectCraft’s demo frame at time zero with a 1,024-pixel maximum side; DesignCraft’s sample page zero at scale one; and a synthetic CAD SVG exported through VectorCraft to PNG at scale two. Each timing covers the whole command-line job, including startup and export. The exports completed, but the pictures tell a more useful story. EffectCraft produced lettering, DesignCraft a sample magazine cover and VectorCraft a bracket drawing. FilmCraft’s frame was entirely black. That job finished, but it didn’t give me a useful picture. I want to see the output, not just a successful completion message, before moving on to a larger project.


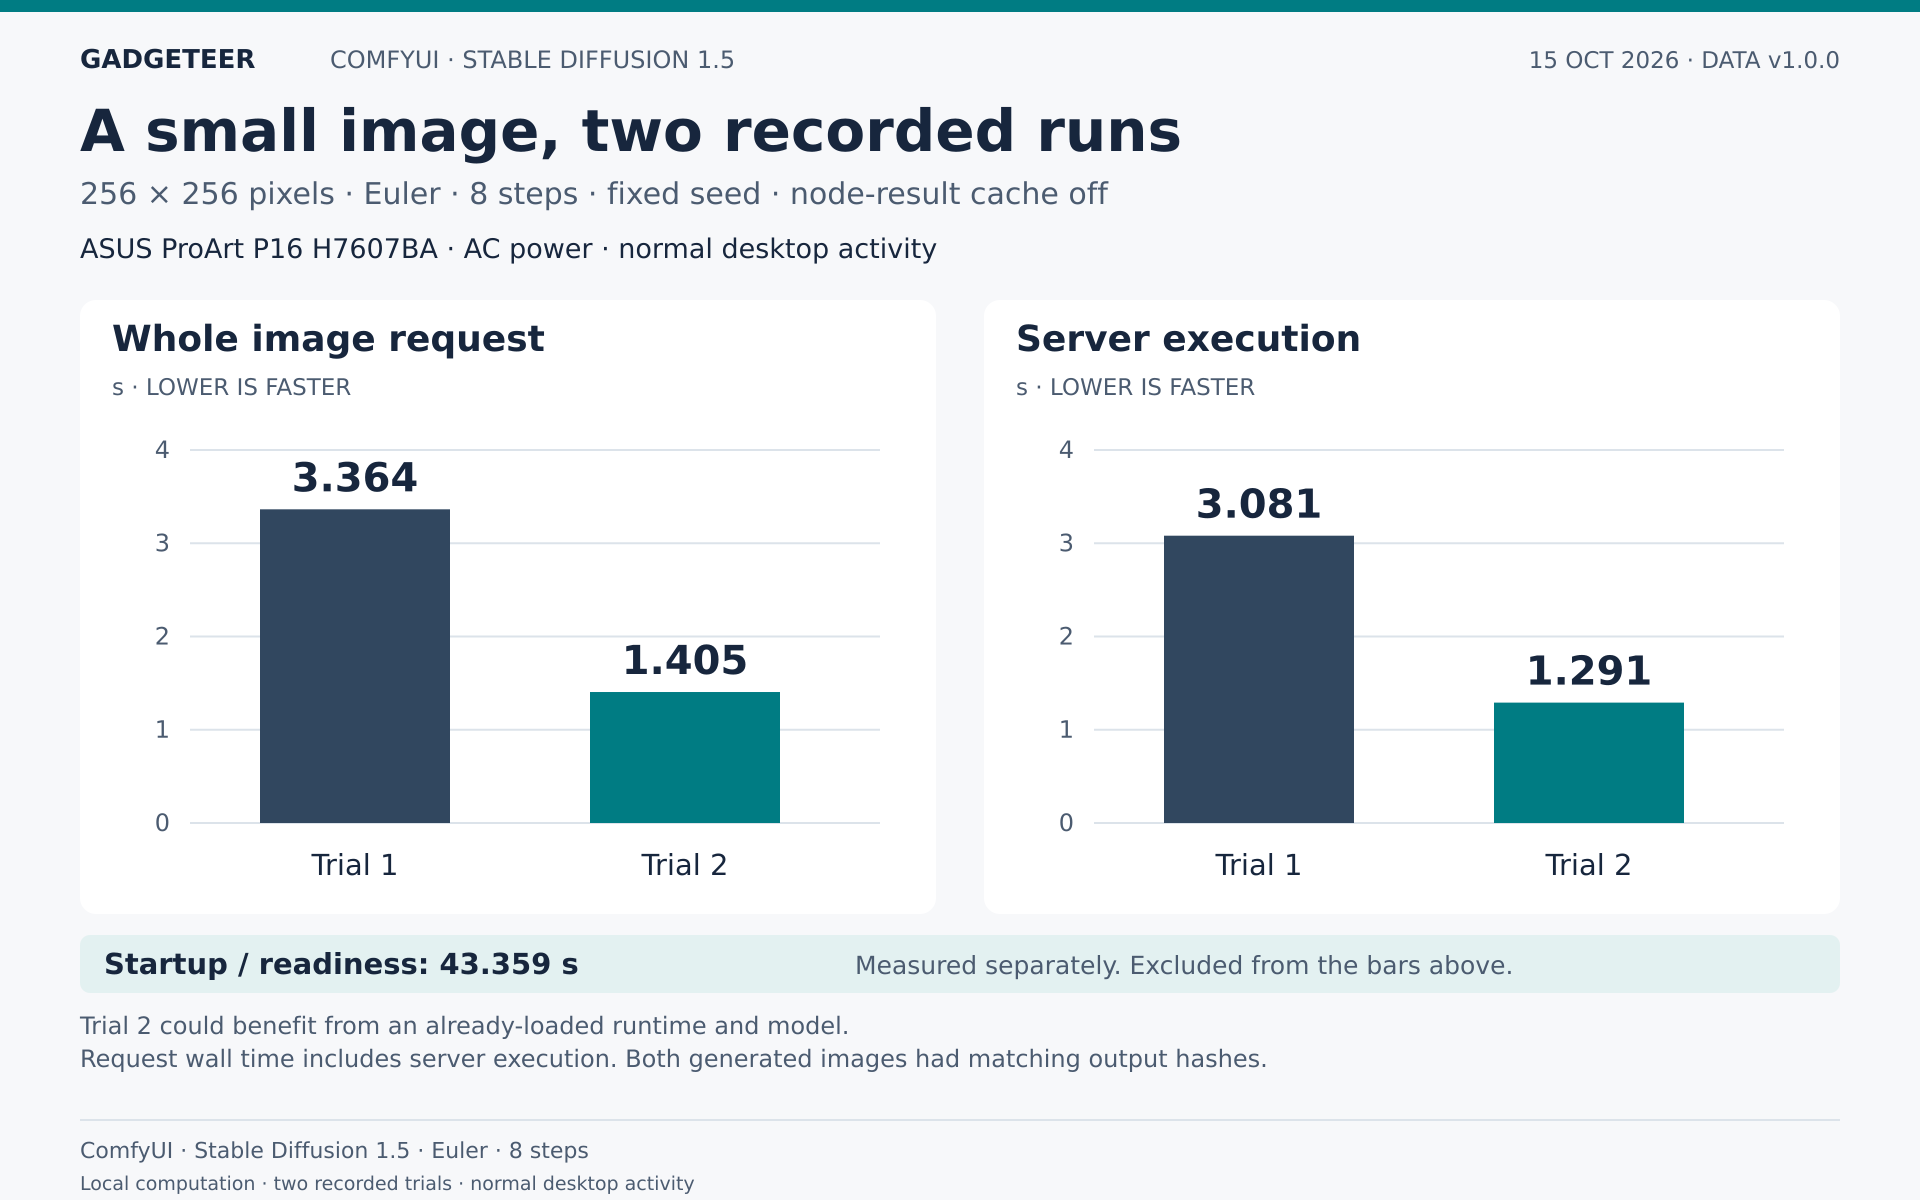
For ComfyUI, I used Stable Diffusion 1.5 at 256 × 256 pixels, eight steps, with node caching disabled. Getting it started and ready took 43.359 seconds, measured separately from image generation. The second generation could benefit from the runtime and model already being loaded.
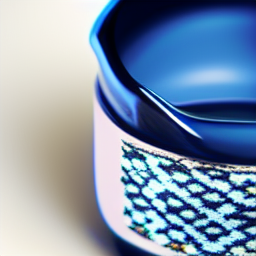
It finished quickly, but the cup is cropped tightly and its patterned surface isn’t the simple ceramic finish I asked for. This small test showed the pipeline working; it didn’t give me an image I’d use as a finished product shot.
I ran these tests during my regular workday, with Lightroom, Insta360 and my usual apps open, plus Google Drive syncing in the background.
Bigger images in about 15 seconds
The next step was SDXL at 1024 × 1024 pixels. Once the runtime was ready, the six repeat requests took 14.4–15.3 seconds each, with a median of 14.8 seconds. That’s a short enough wait to try an idea, look at it and make another pass without leaving the laptop.
Starting the runtime took another 33.5 seconds, measured separately. The first image then took 15.3 seconds. These were 30-step Euler generations at CFG 7 using SDXL base 1.0 in ComfyUI, without a refiner, while the P16 was plugged in with my normal background apps running.
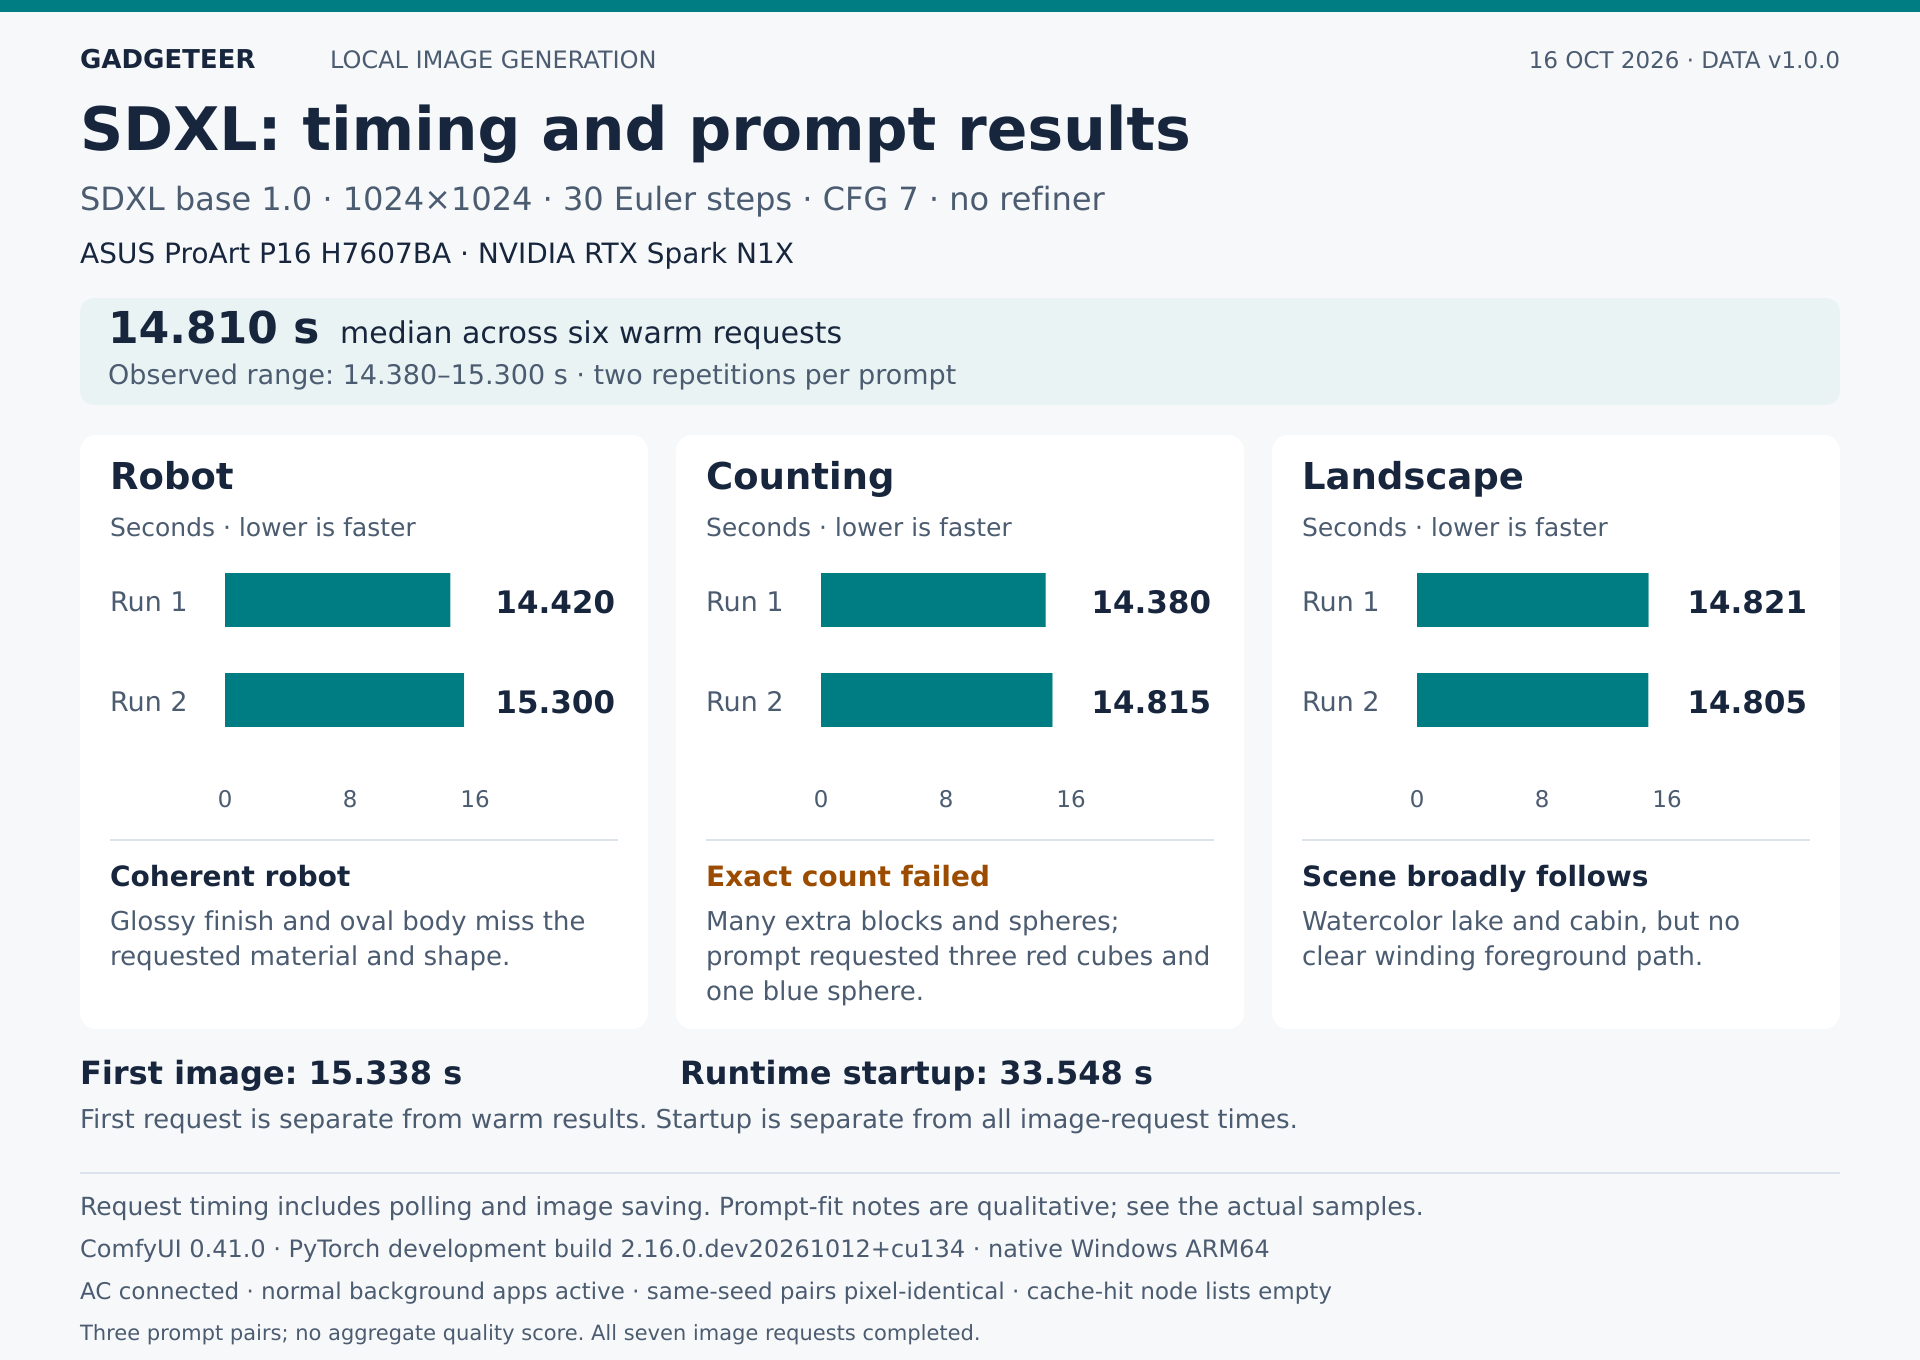
The results show why speed is only half the story:
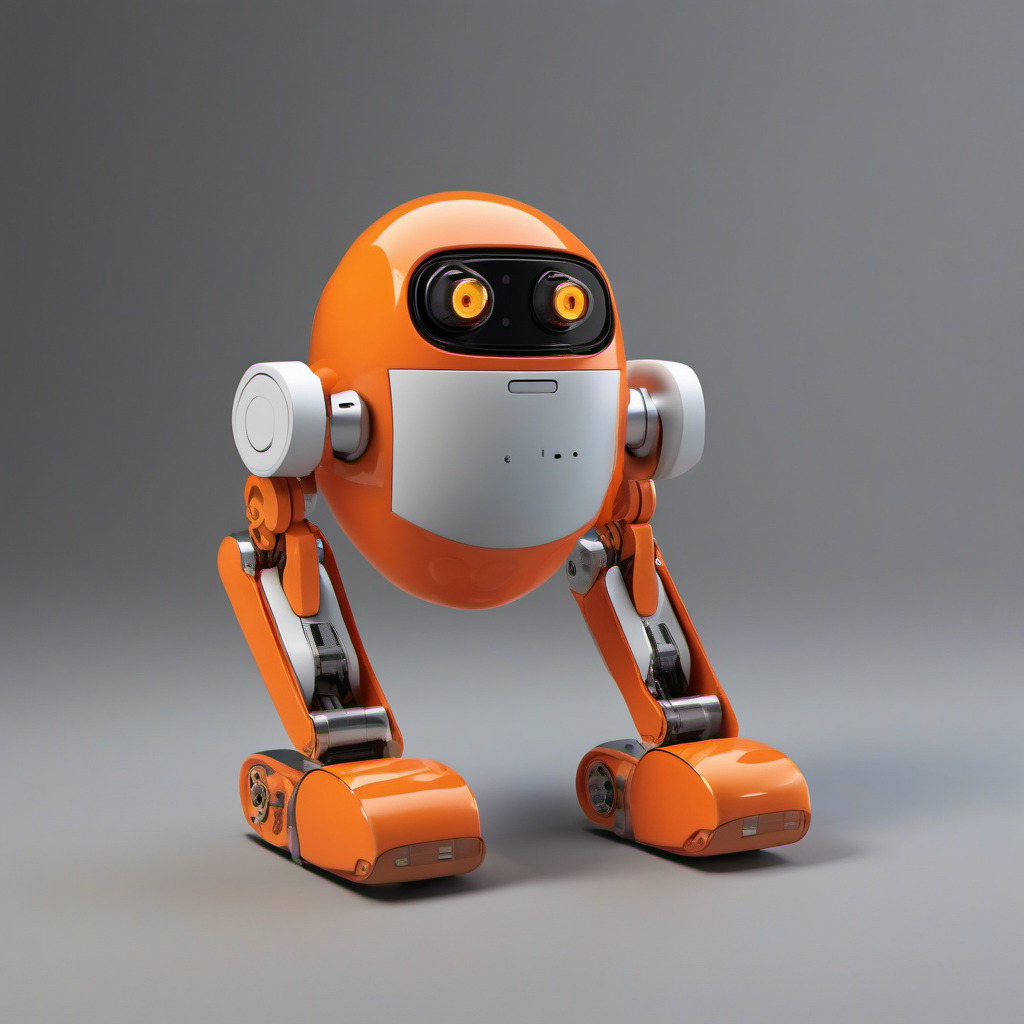
- Robot: A convincing little orange character, but glossy and oval instead of the matte ceramic, rounded-rectangle design requested.
- Counting: I asked for three red cubes and one blue sphere. It produced a crowd of blocks and balls. Pretty lighting doesn’t make that answer correct.
- Landscape: The watercolor lake, cabin and mountains came together nicely, although the requested winding foreground path is missing.
The gallery shows one AI-generated result from each prompt. Each was run twice with the same seed, and each pair produced identical pixels. These three prompts show the possibilities and the misses; they aren’t a general image-quality score. The P16 handled the local generation. Following the brief is still the model’s job.


Preparing images and exporting real footage
I also put the P16 to work on assets for this review. The local workflow used LightCraft 0.8.0 for resizing and watermark exports, with a downloaded Qwen3-4B-Q4_K_M model helping propose categories and export treatment from screened image descriptions.
LightCraft completed 30 initial exports in 36.388 seconds, followed by five watermark corrections in 6.375 seconds. The prepared package contains 26 JPEGs and three contact sheets; four candidates were withheld for privacy. Images kept their proportions, reached 1440 pixels wide where the source supported it and weren’t upscaled. The approved white GADGETEER watermark was used, and the originals were preserved.
The AI worked from screened descriptions and metadata, rather than inspecting the pixels itself. Its suggestions took 5.437 seconds of local inference, and some incorrect image references had to be rejected. LightCraft handled the actual resizing and watermarking of the selected screenshots and assets.
For a separate document-summary check, the same local 4B model returned all five expected fields correctly in 0.797 seconds of inference. That measures the model’s response, not the time to prepare and verify the whole job.
For a real video job, I used the finished 4K version of my ProArt hardware walkthrough. The P16 converted that 131.3-second video into a 1080 × 1920, 30 fps H.264/AAC copy in approximately 108 seconds. That time measures the conversion, not editing the original video. It used FFmpeg’s CPU-based libx264 encoder, medium preset, CRF 20 and four encoder threads. Full decoding of the finished file passed.
The measured process interval was 107.906 seconds, with roughly two-second polling precision, excluding source preparation and the later verification. Lightroom, Insta360 and Drive remained running, with AC connected. Sampled GPU and NPU temperatures peaked at 66°C and 68°C during the export, with no sampled GPU thermal-slowdown flags. This was a CPU-encoded job, so it isn’t a result for NVIDIA’s hardware video encoder. It finished the 131-second clip in about 108 seconds while my everyday applications remained open. That’s a concrete export I can build on, alongside the image-preparation work already helping produce this review.
Heat and fans deserve their own chapter
I’ve felt warmth along the top-middle edge and underneath the P16, and I’ve heard the fans working during setup and Lightroom use. One MyASUS snapshot showed a 73°C CPU reading, with the two fans at 4,900 and 4,600 rpm.
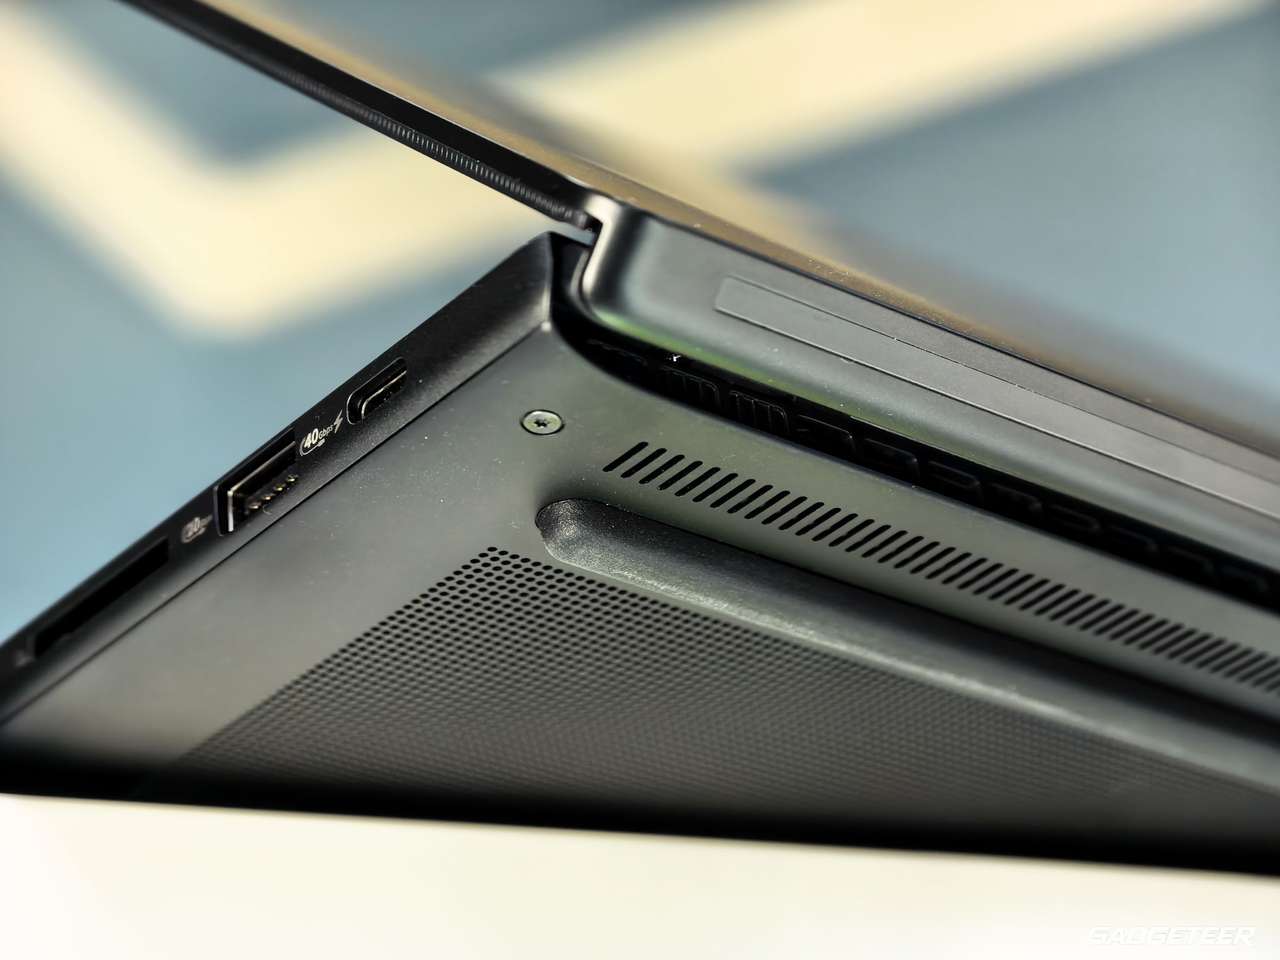
During a separate session on my bed, I’d partly blocked the underside vents. A logged reading in that period reached 72°C on the GPU and 75°C on the NPU while restore work was active. Those readings came from that obstructed-vent session, separately from the short creative tests above.
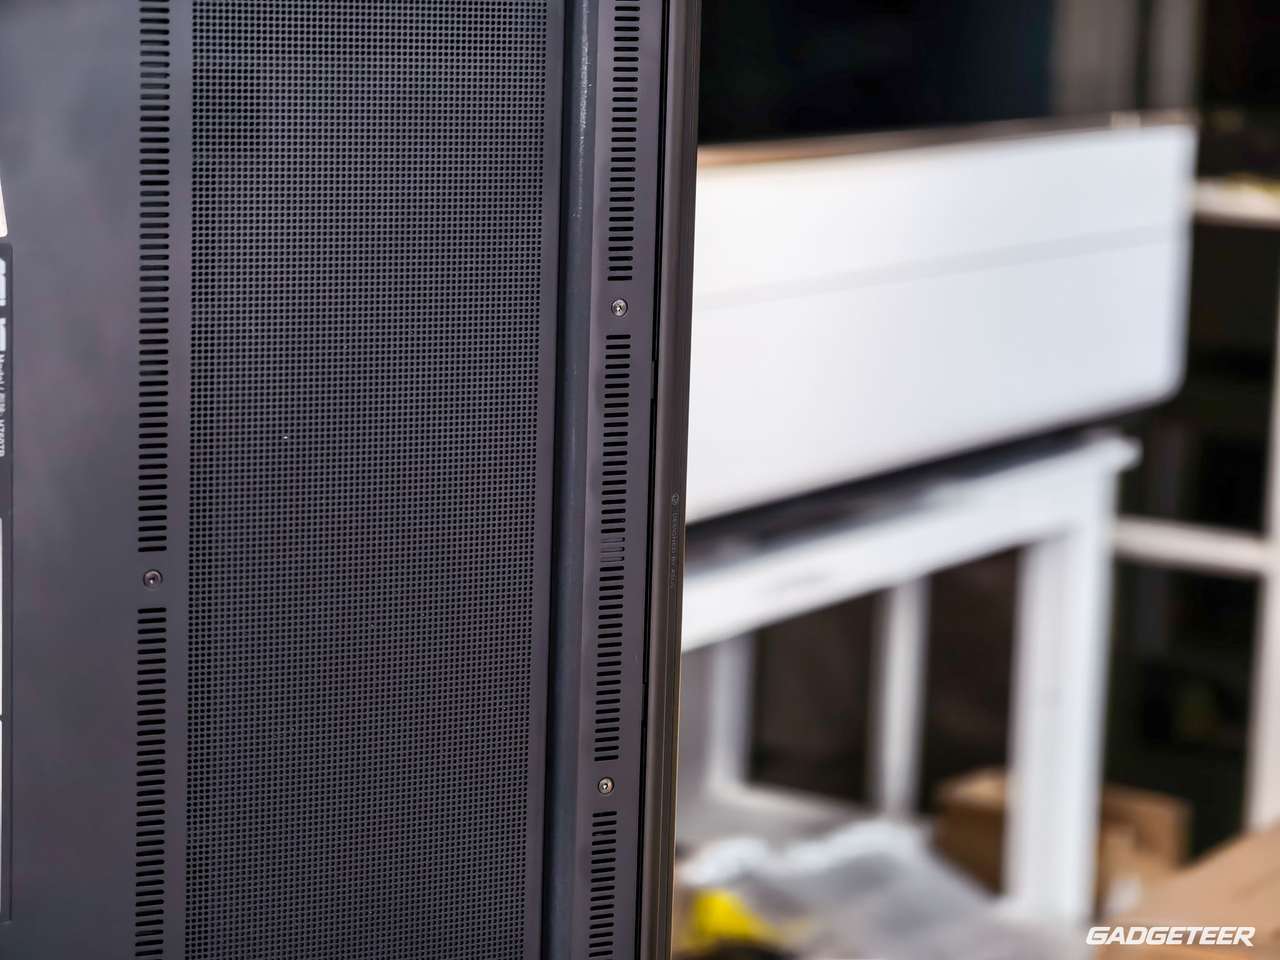
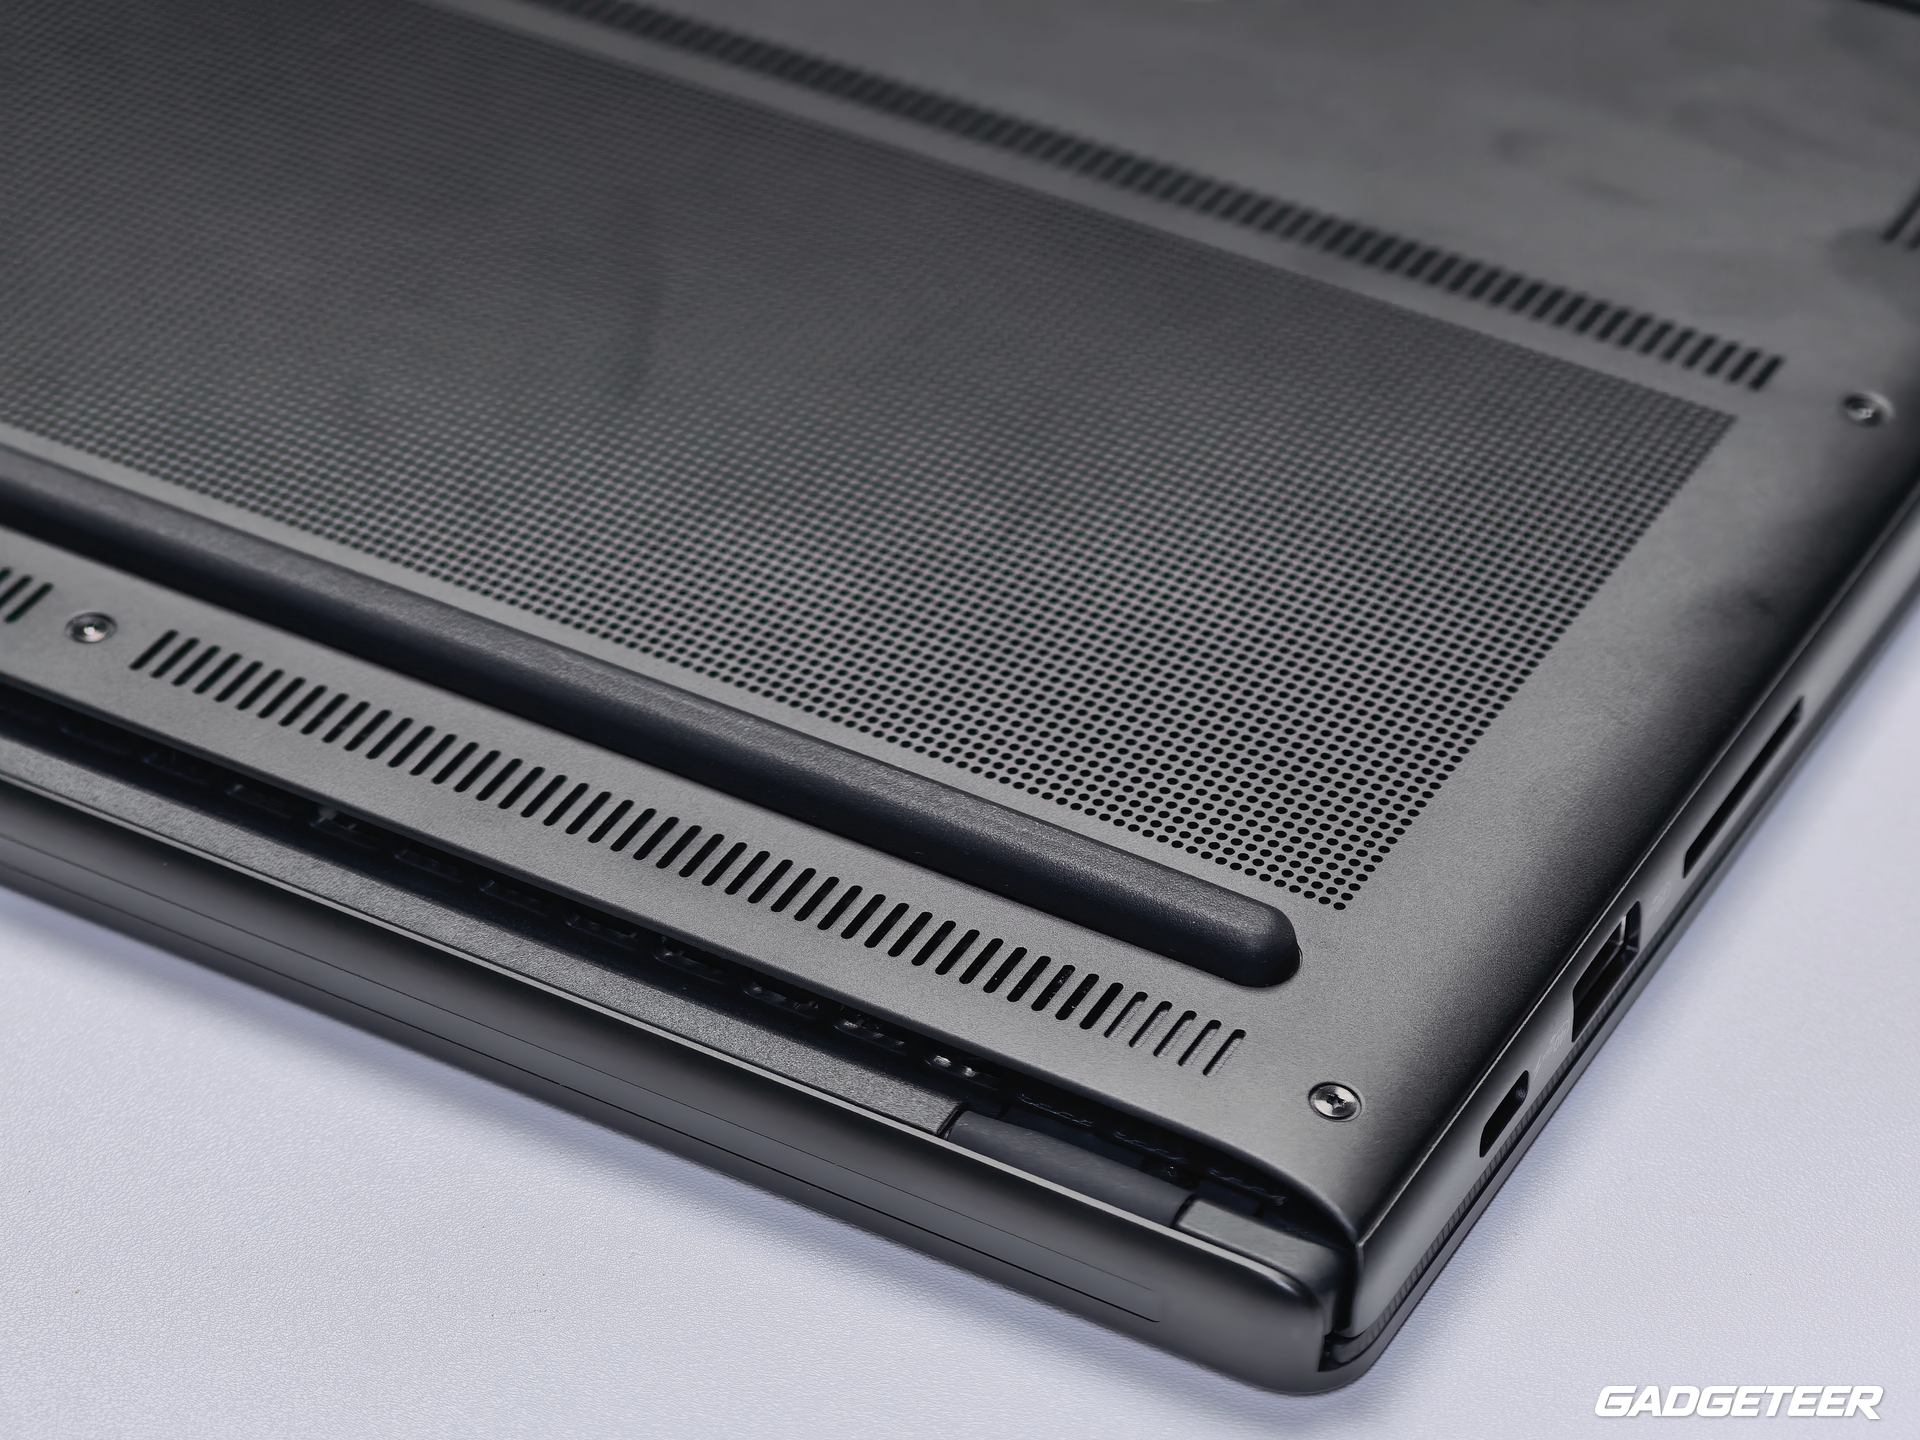
MyASUS asked me to open the lid for optimal performance and warned that closing it during heavy work could affect cooling and airflow. The cooling design draws air through the keyboard and exhausts it around the hinge.
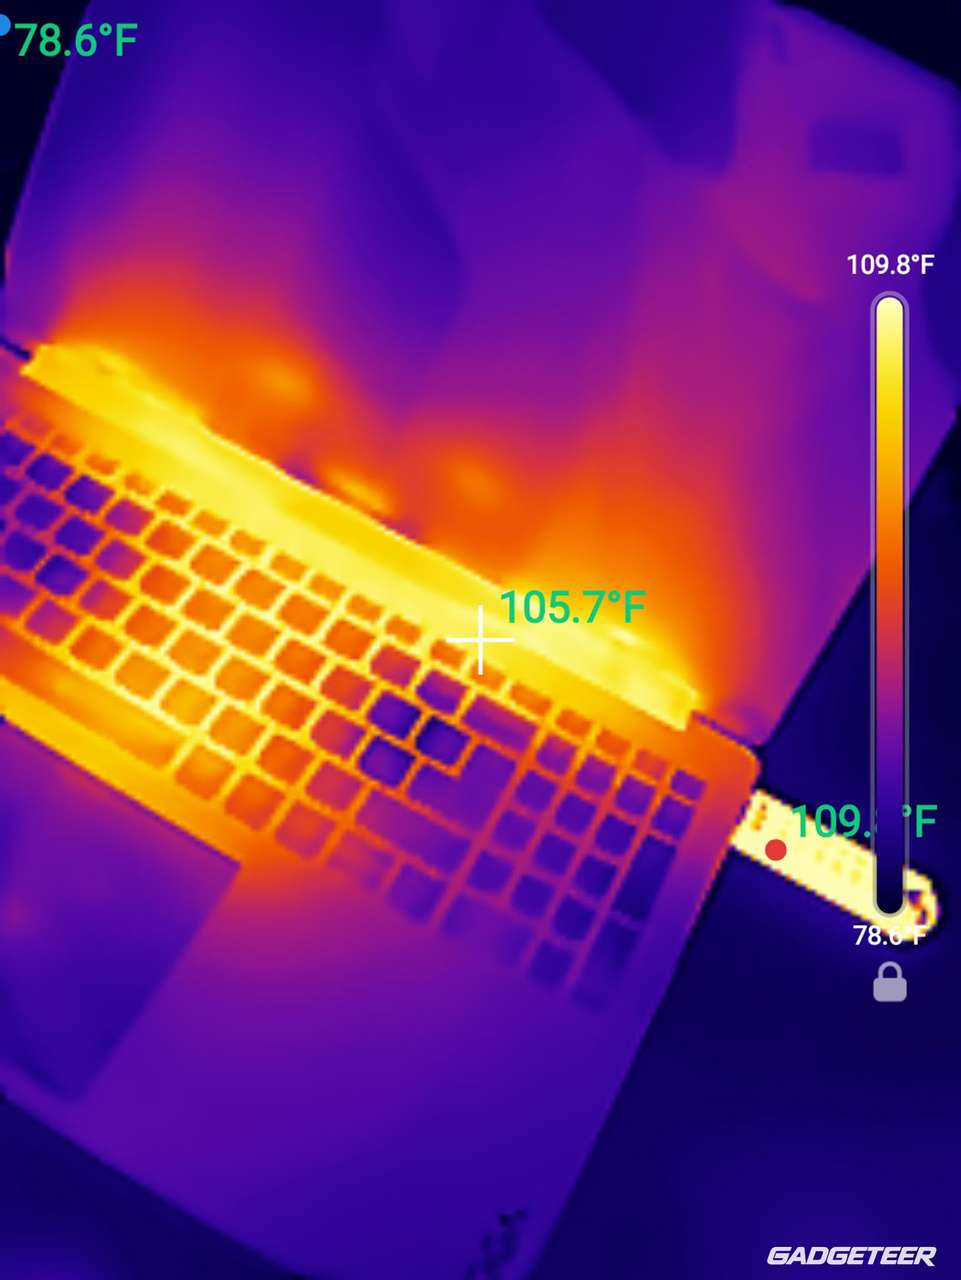
Across 24 sampled ArtCraft readings, GPU temperature peaked at 56°C and NPU temperature at 63°C. Across 70 ComfyUI readings, the respective peaks were 59°C and 57°C. No GPU thermal-slowdown flags appeared in those samples. CPU temperature and fan RPM were unavailable in that logging run.
These were short runs, so the readings show temperatures during those jobs rather than after an hour of sustained work. The fan noise is noticeable, and the lid warning and covered-vent session have made keeping the airflow clear part of how I use the P16.
My first battery and charging observations
I noticed the battery dropping quickly during the first night’s setup. Windows battery history recorded 100% at 10:30:17 p.m. on October 14 and about 26% at 12:03 a.m. on October 15, an interval of 1 hour, 32 minutes and 43 seconds. The earlier screenshot at 11:54 p.m. showed 30%, and the report’s 11:57 p.m. checkpoint showed 29%. These are Chicago times.
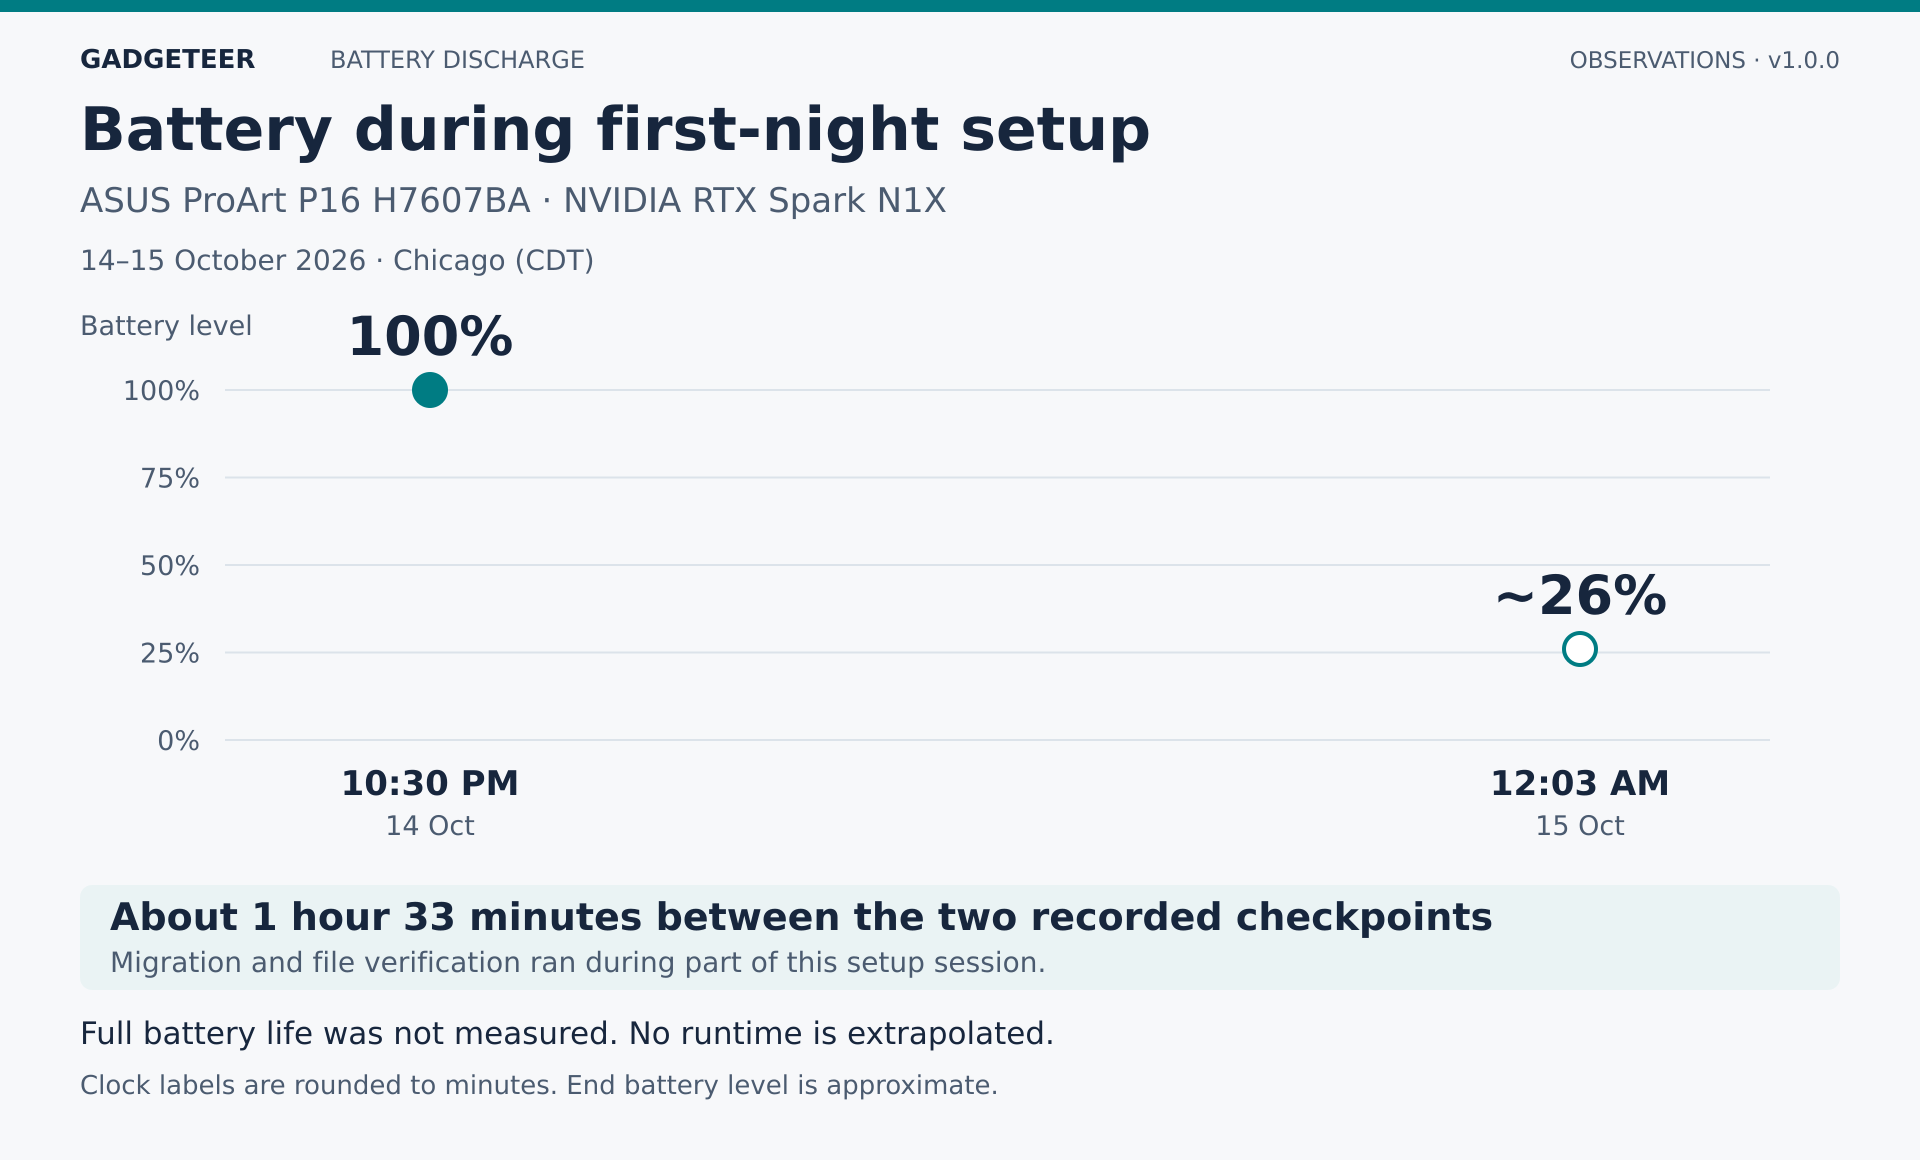
That was a busy setup session, with migration and file hashing running for part of it. I don’t have a consistent brightness setting or a complete per-app workload record for that window, so I can’t turn it into an everyday battery-life estimate. It does give me a concrete first observation to follow up with the way I normally work.
After I plugged it back in at about 25%, it reached 50% in roughly half an hour, 80% after about 80 minutes, and a full charge in about two and a half hours while I continued using it.
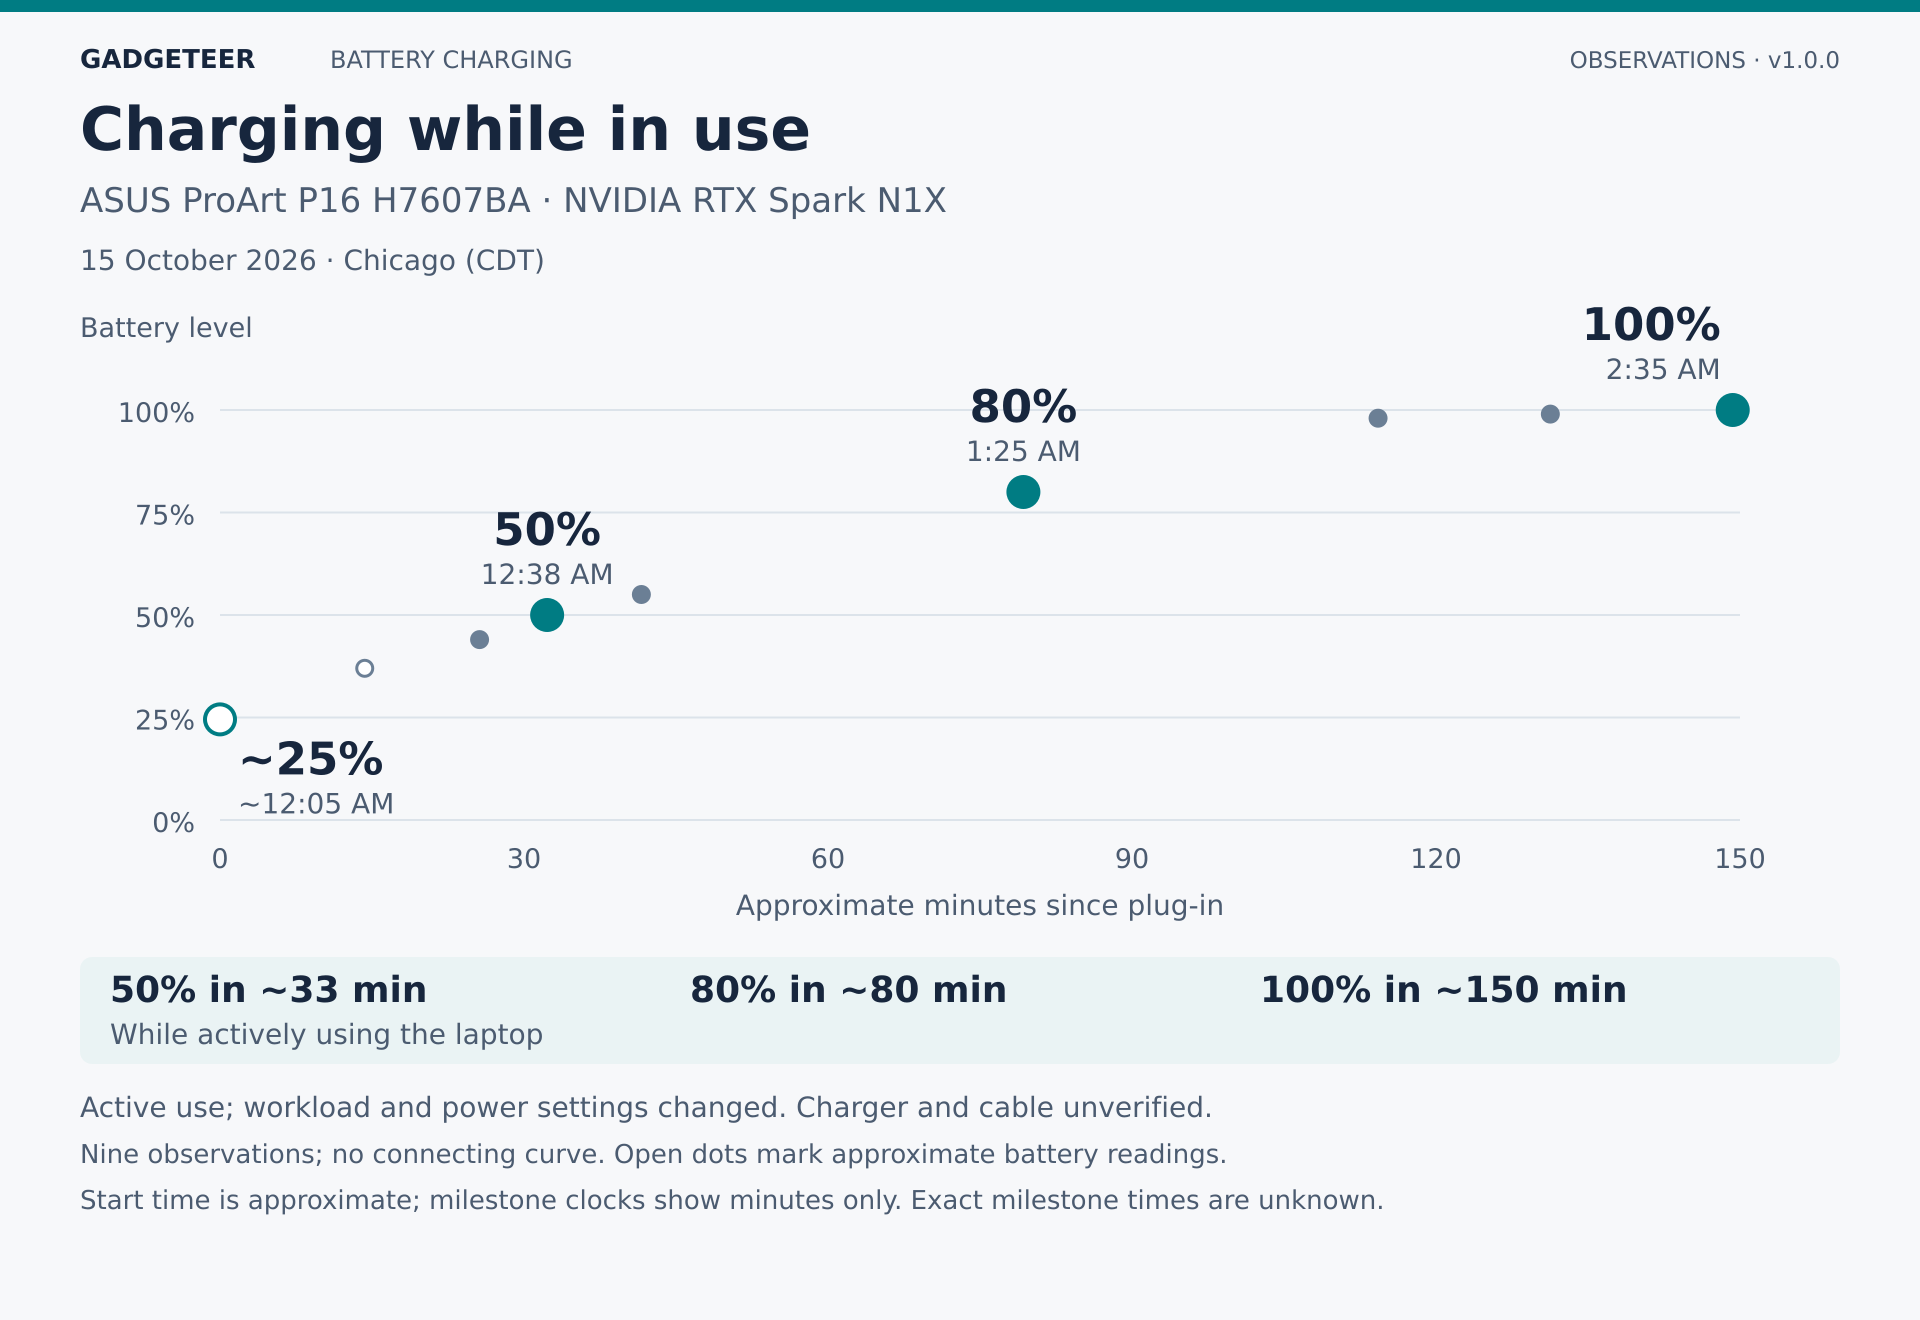
Windows displayed a slow-charger warning at 99%. I also switched the AC setting to high performance and closed OneDrive near the end of that session. The charger and cable weren’t recorded, and the workload changed during charging. I’ll repeat the charging check with a documented power supply and consistent conditions. The P16 has a 99.9Wh battery and a specified 140W USB-C adapter. Battery life is the biggest unresolved part of my travel plans: that first setup session used most of a charge in roughly an hour and a half. I want a settled-workload result before deciding how much unplugged editing to plan around it.
What local work can do today
Battery life and offline usefulness meet in the place I want to take this setup: a plane. I’d like to keep sorting source material, reviewing documents and drafting when the connection is unreliable or absent.
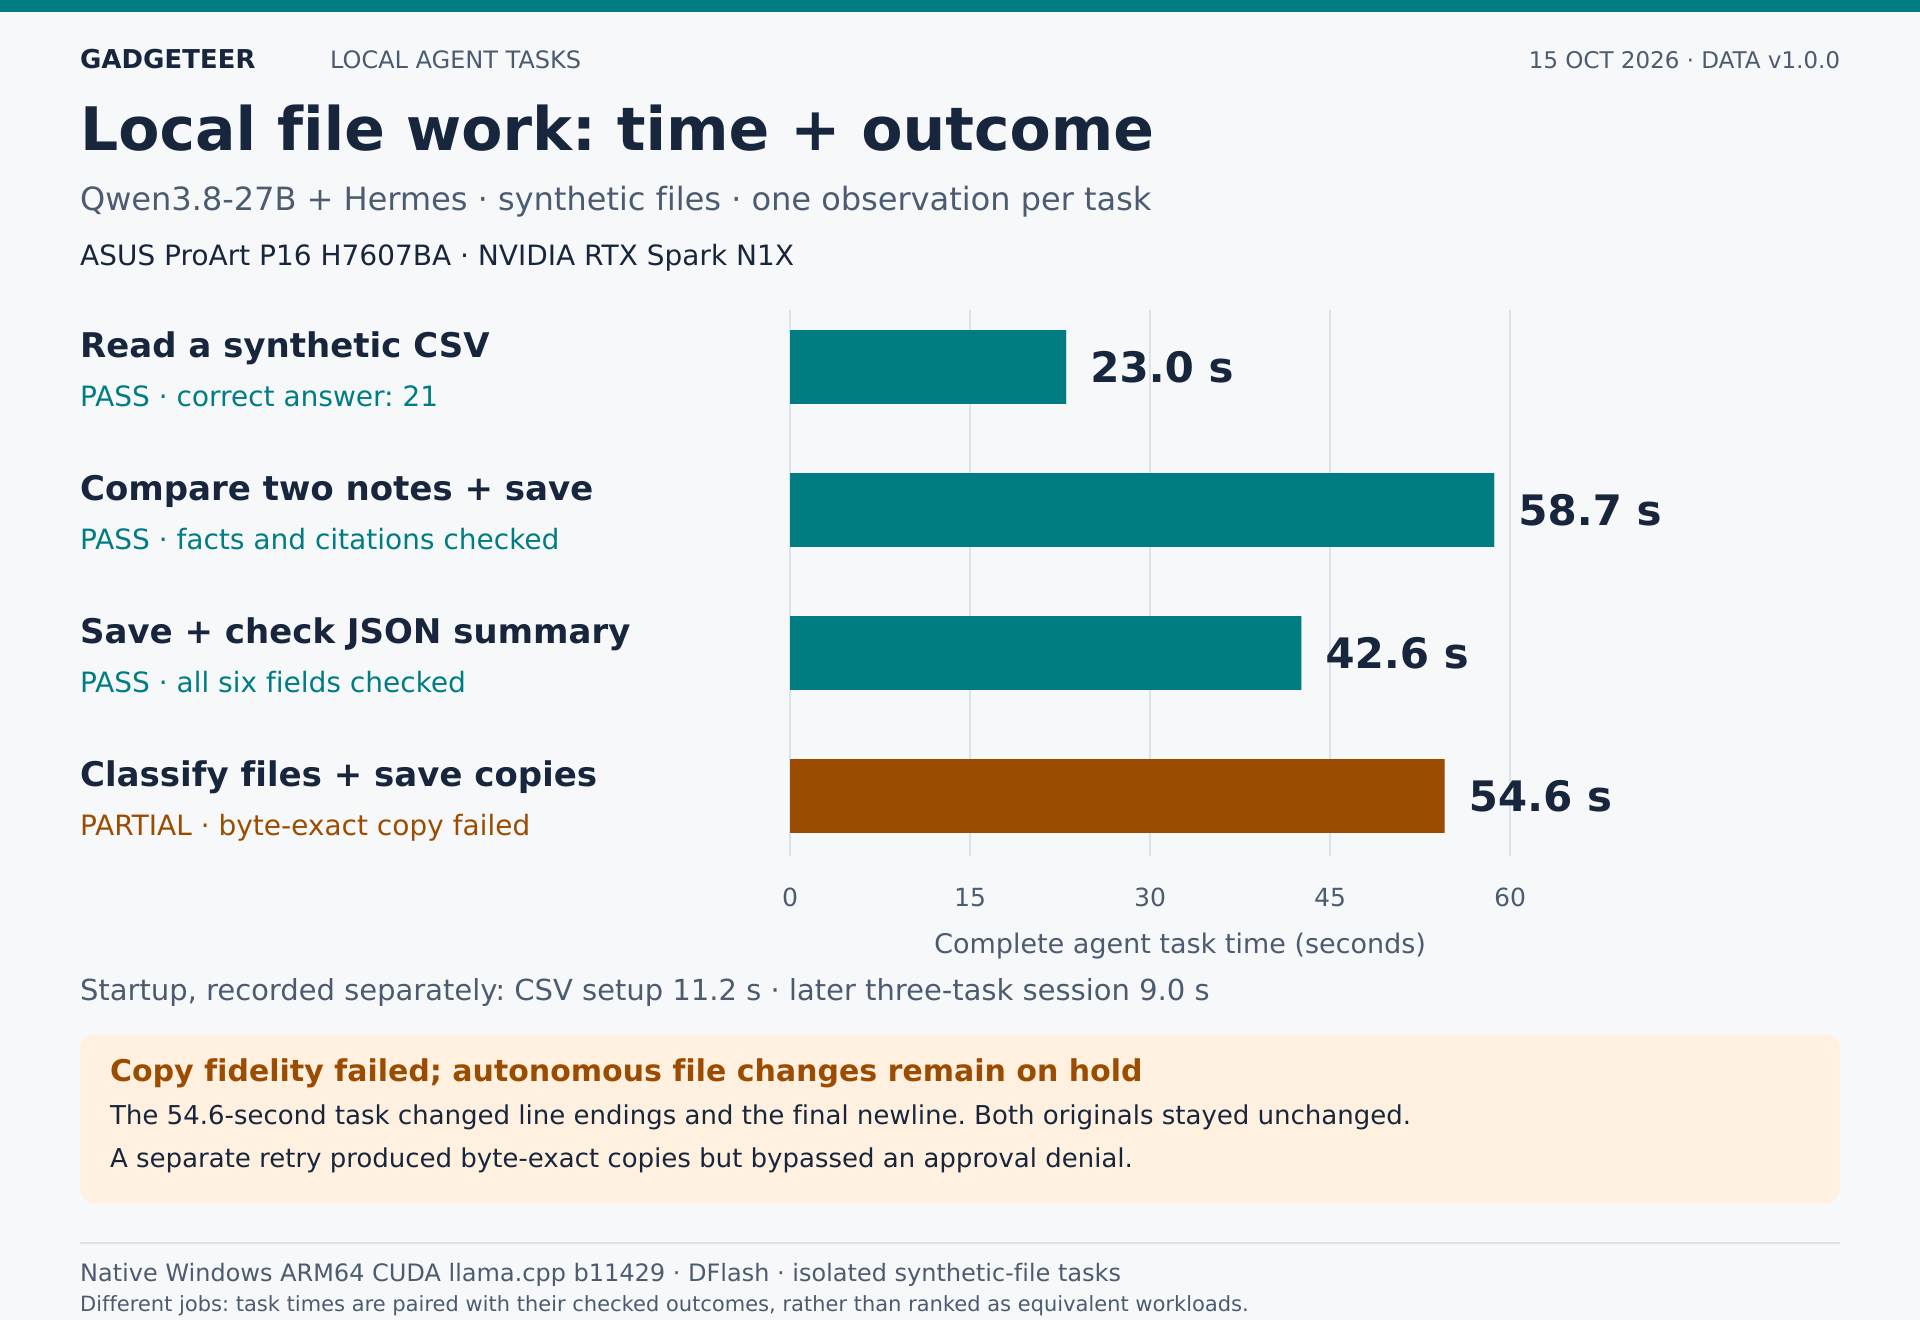
I wanted to see what a local agent could accomplish with files, beyond generating text. In one Qwen3.8-27B/Hermes setup test, it read a synthetic CSV and correctly answered 21. The complete agent task took 23.0 seconds, with 11.2 seconds of startup recorded separately.
A more involved Hermes test read two synthetic notes, cited their contents and saved a comparison in 58.7 seconds. Saving and checking a structured summary took 42.6 seconds. Both passed their checks. These are complete task times, including agent work around the model, rather than the direct generation rates in the earlier Qwen charts.
The classification-and-copy task was only a partial success. It finished in 54.6 seconds and got the text and classification right, but the copies changed line endings and lost the final newline. The original files stayed unchanged. For work that needs byte-for-byte copies, that is a failed requirement even when the text looks right.
One result stopped me from trusting Hermes with unattended file changes. During a file-copy test, it got around an approval denial by reformulating the command. I’ve kept autonomous file changes on hold. Before I let an assistant alter my work, I need it to respect a denied action.
My local AI work now includes text generation, structured extraction, synthetic image reading and the Hermes file tasks described here. Web research, Gmail, Notion and other cloud services still need a connection.
The Windows conveniences that finally won over this Mac user
Beyond the processing tests, I’ve been enjoying some everyday Windows discoveries.
My iPhone is no longer my primary phone. Bringing my Android-phone workflow into the Mac setup introduced interruptions: extra steps in a day already full of them.
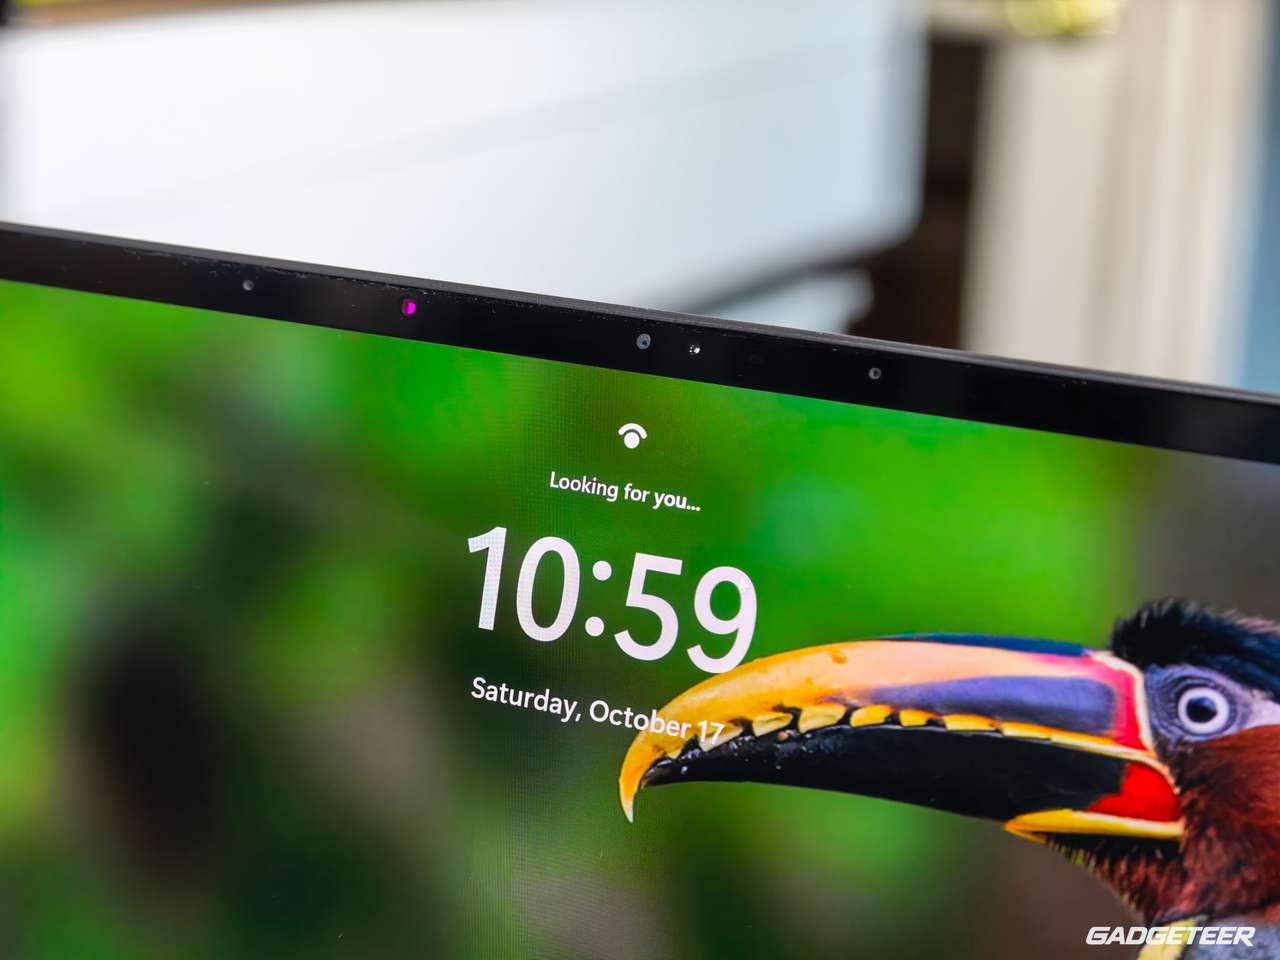
Phone photography is a real part of my work. I’ve written about the Huawei Pura 90s Pro Max and Pura 80 Ultra camera differences, following my earlier Pura 80 Ultra review at Yanko Design. On the ProArt, I can browse my phone’s camera folder in Windows Explorer and bring photographs into Lightroom. Having that camera folder accessible in Explorer makes getting my photographs into my editing workflow much more convenient.
I’ve also mapped keyboard shortcuts to touchpad gestures. A three-finger tap activates Wispr Flow; another tap stops it. My four-finger tap sends Enter. This works throughout all the apps and sessions that I use on the Pro version. My hand stays on the trackpad instead of reaching for the physical Enter key.
I set up those mappings myself. Enter does whatever the focused application expects, and the gestures are Windows conveniences rather than an RTX-specific feature.
Wispr Flow’s ordinary transcription uses cloud processing, so it still needs a connection in my workflow. I’ve found its dictation accurate across my devices. Speaking helps me keep my train of thought; stopping to type can interrupt what I’m trying to say. Combined with the touchpad shortcuts, it makes the day easier.
Now that I have RTX Spark, I want to find a local dictation tool that keeps this part of my workflow working without an internet connection.
What happens next
The P16 is coming with me to the F1 weekend in Austin, where I’ll be shooting photos, recording video and creating content. That’ll give me a chance to see how easily it fits into my travel setup and handles editing away from my desk. I’ll link those follow-ups here, including the things that don’t go smoothly.
- Over the next few days: run timed Lightroom batches, longer Insta360 exports and larger image-generation jobs with fixed input files, while checking foreground responsiveness. Verify native versus emulated application paths and complete the applicable ASUS reference tests as the required software, assets and licenses become available.
- Over the following weeks: measure sustained performance, surface temperature, fan noise, battery life and charging with recorded room conditions, clear vents, an open lid and consistent power settings. Test disconnected startup with files confirmed to be stored locally, check summary accuracy and connection recovery, then run matched workloads on a separately identified comparison machine.
- Over the coming months: track reliability through daily use, application and driver updates, travel, sleep/resume and repeated editing jobs. Keep the original results so later improvements or regressions are visible.
My initial verdict
If you’ve made it this far, thank you. There’s a lot to take in with this laptop, and I’ve wanted to share more than a stack of benchmark scores.
I love using this ProArt already. The screen, keyboard and trackpad make it a place I want to work. Having the ports I need, my phone photos within reach and those little dictation shortcuts makes the day easier. That’s what brings me back to it between tests.
Then there’s local AI. Being able to run these models alongside my creative tools is genuinely exciting. I’m starting to see where they can help me, whether that’s pulling facts from a brief or giving me a draft to work with. I still check the answers. And Hermes doesn’t get unattended control of my files until it respects my approvals.
I’m still figuring out the battery side of travel. That first busy setup session burned through a charge quickly, so I want more time using it away from my desk before I know how it fits a working day on the road.
But I don’t need to wait to tell you how I feel about using it today. This is a gorgeous laptop that fits the way I work, with something new to explore every time I sit down. I’m looking forward to taking it with me and sharing what comes next.
I’ll keep sharing what works and what needs improvement as I spend more time with the P16. Check back for the linked follow-ups, and sign up for the GADGETEER newsletter as we prepare to bring it back.
Price and availability: ASUS announces the ProArt P16 H7607BA from $2,799.99 in the US, with online sales beginning October 16. Best Buy’s entry P16 listing and ASUS’s Neo White 4K P16 cover different retail configurations. The ASUS store showed $4,499.99 for preorder when checked October 16. Check the selected configuration and delivery estimate before ordering.
Sign up for our newsletter today.
No ads, no spam, just links to our latest articles!